Gold technical analysis: Bearish bias strengthens with drop to one-month lows
- Gold fell to a one-month low of $1,486 soon before press time.
- The slide to four-week lows has bolstered the bearish technical setup and exposed the 50-day MA support at $1,469.

Gold is currently trading at $1,488 per Oz, having dropped to $1,486 soon before press time. That was the lowest level since Aug. 13.
The slide to one-month low has strengthened the bearish bias put forward by the daily chart double top breakdown confirmed on Thursday and the weekly chart bearish engulfing pattern.
Also, the relative strength index (RSI) is now reporting bearish conditions with a below-50 print. The indicator has turned bearish for the first time since May.
The 5- and 10-day moving averages (MAs) are also trending south, indicating a bearish setup. All-in-all, the yellow metal risks falling to the 50-day MA, currently at $1,469.
A minor bounce may precede a drop to $1,469, as the intraday charts are reporting oversold conditions.
Daily chart
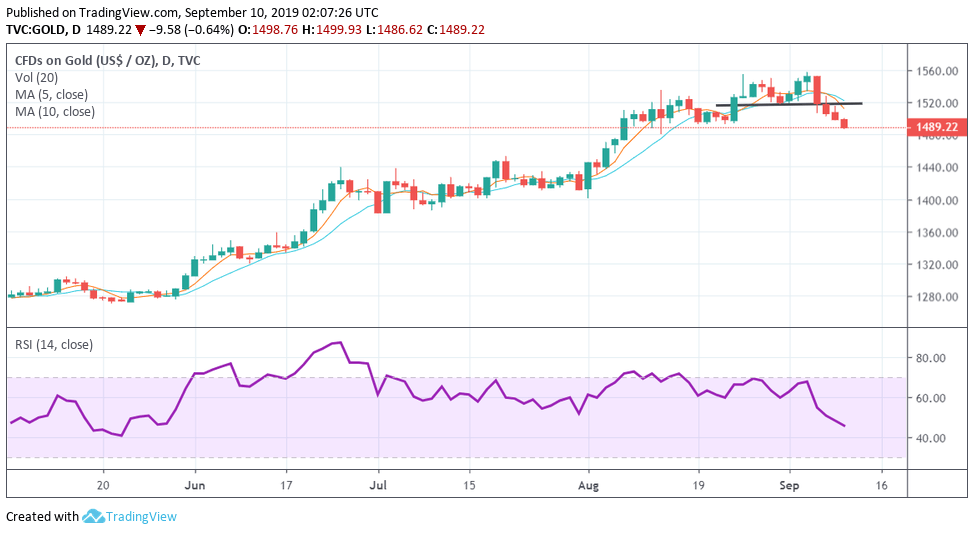
Trend: Bearish
Technical levels
Author

Omkar Godbole
FXStreet Contributor
Omkar Godbole, editor and analyst, joined FXStreet after four years as a research analyst at several Indian brokerage companies.


