Gold supported by safe-haven flows as strength of US labor market weighs
- Gold finds support from continued safe-haven flows and demand from long-term investors.
- This acts as a counter-weight to pressure from reduced expectations of interest rates being slashed in the US.
- Technically, XAU/USD continues consolidating in a medium and long-term uptrend.

Gold (XAU/USD) continues to bounce down a roughly week-long range between about $2,630 and $2,670 on Monday after the release of negative-for-Gold US employment data gets neutralized by persistent safe-haven demand.
According to data released on Friday, US Nonfarm Payrolls (NFP) beat economists’ expectations by a wide margin, rising by 254K in September when forecasts had only been for a 140K increase. The US Unemployment Rate, meanwhile, fell to 4.1% from 4.2% when markets had feared the opposite, according to data from the Bureau of Labor Statistics (BLS). The release revealed the US economy was in good shape, averting fears of a “hard landing”.
The reason the NFP report is important is because, since August, the labor market has taken over from inflation as the chief concern of the US Federal Reserve (Fed). It was then that Fed Chairman Jerome Powell stated in a pivotal speech that, "We do not seek or welcome further cooling in labor market conditions."
The better-than-expected NFP data significantly reduced the chances of the Fed making another double-dose 50 basis points (bps) (0.50%) rate cut at its November meeting. The probability of such an outcome has fallen to zero on Monday from around 35% prior to the release, with markets now even pricing in over a 10% chance of the Fed not cutting interest rates at all, according to the CME Fedwatch tool.
Consequently, the NFP release pushed the Gold price down to its low of the day at around $2,632 on Friday. This is because the expectation of interest rates remaining elevated reduces the attractiveness of Gold as a non-interest-paying asset and strengthens the US Dollar (USD), adding a further headwind to the yellow metal, which is mainly priced and traded in the currency.
Gold finds support from safe-haven demand
Gold price benefits from continued demand as a safe-haven asset as the conflict in the Middle East worsens and intensifies. According to the latest reports, Israeli forces have blown up a mosque in the southern Lebanese village of Yaroun, says Aljazeera News.
Markets are also on tenterhooks as Israel is widely expected to launch an imminent retaliatory attack on Iran after its rocket attack last week. Iran launched around 200 missiles, many of them ballistic, to avenge the death of Hassan Nasrallah, the head of the Iran-backed group Hezbollah.
The yellow metal is further supported by hopes of a revival in demand from China following the government’s decision to stimulate the economy with a huge package of measures. China constitutes Gold’s largest market, so the health of the Chinese economy can be a key factor that impacts its price.
Further, the overall trend lower in global interest rates – notwithstanding the recalibration of their trajectory in the US – enables Gold to retain its attractiveness as a portfolio asset.
Technical Analysis: Gold range-trade into trendline
Gold extends its narrow sideways move, clearly visible on the 4-hour chart below. It has also reached a key trendline which provides a firm level of support at the lows.
The immediate range is composed of a ceiling at $2,673 (October 1 high) and a floor at $2,632 (October 4 low) – whilst the trendline also offers a rising shelf of support in the mid $2,440s.
The short-term trend is sideways, and given the technical analysis principle that “the trend is your friend,” it is more likely than not to endure with price oscillating between the aforementioned poles.
XAU/USD 4-hour Chart
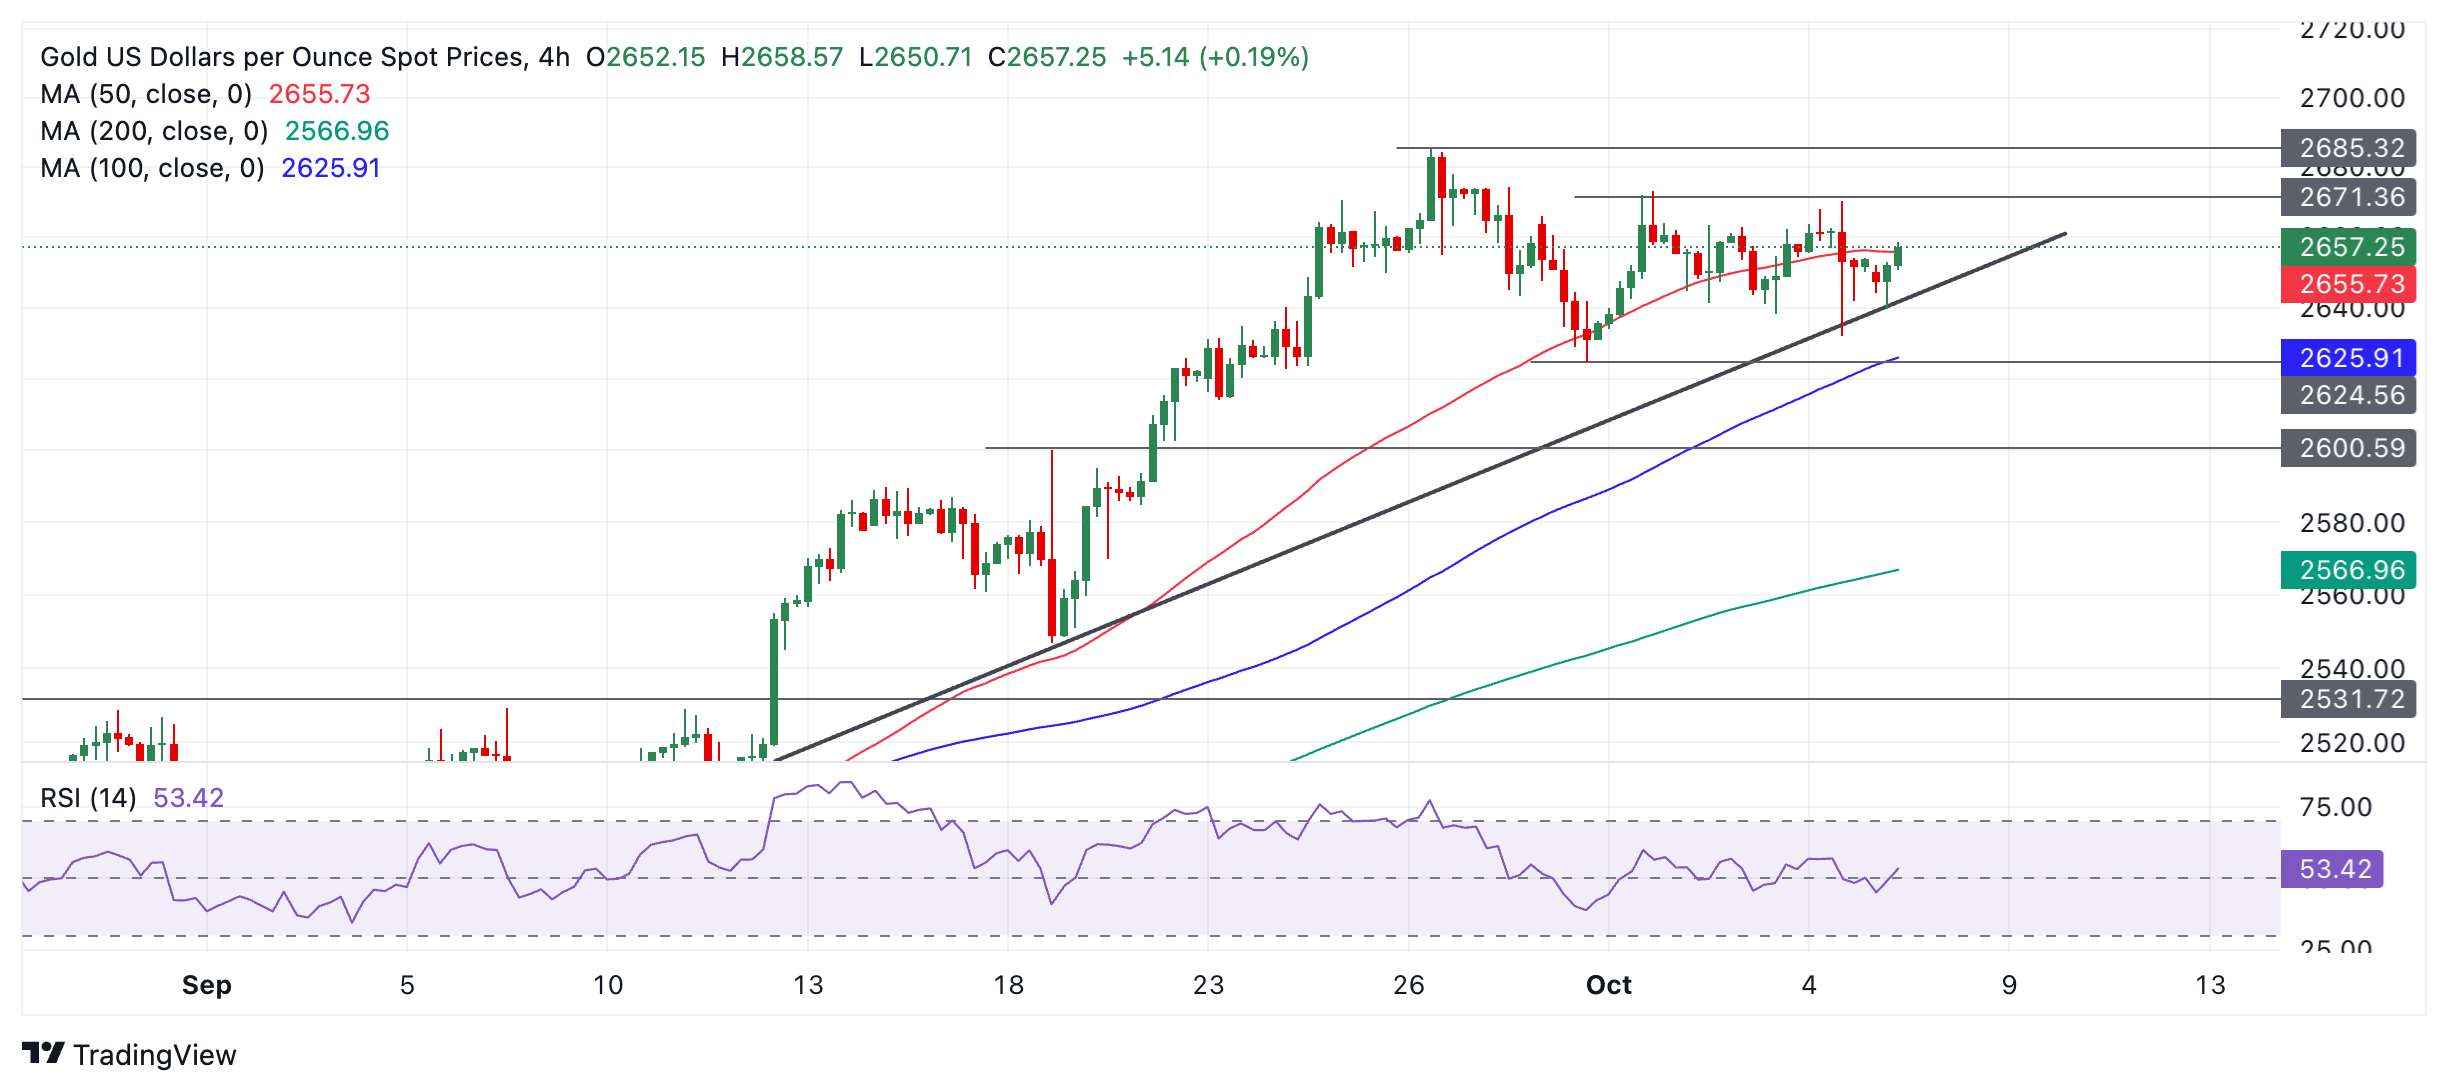
A break above $2,673 would increase the odds of a resumption of the old uptrend, probably leading to a continuation up to the round-number target at $2,700.
A break below $2.632 would lead to a move down to at least the swing low of $2,625 (September 30 low). A break below that level would likely see prices give way to support at $2,600 (August 18 high, round number).
On a medium and long-term basis, Gold remains in an uptrend, with the odds favoring an eventual resumption higher once the current period of consolidation has ended.
It would require a breakout either above the top of the range or below the bottom to confirm a new directional bias.
Economic Indicator
Nonfarm Payrolls
The Nonfarm Payrolls release presents the number of new jobs created in the US during the previous month in all non-agricultural businesses; it is released by the US Bureau of Labor Statistics (BLS). The monthly changes in payrolls can be extremely volatile. The number is also subject to strong reviews, which can also trigger volatility in the Forex board. Generally speaking, a high reading is seen as bullish for the US Dollar (USD), while a low reading is seen as bearish, although previous months' reviews and the Unemployment Rate are as relevant as the headline figure. The market's reaction, therefore, depends on how the market assesses all the data contained in the BLS report as a whole.
Read more.Last release: Fri Oct 04, 2024 12:30
Frequency: Monthly
Actual: 254K
Consensus: 140K
Previous: 142K
Source: US Bureau of Labor Statistics
America’s monthly jobs report is considered the most important economic indicator for forex traders. Released on the first Friday following the reported month, the change in the number of positions is closely correlated with the overall performance of the economy and is monitored by policymakers. Full employment is one of the Federal Reserve’s mandates and it considers developments in the labor market when setting its policies, thus impacting currencies. Despite several leading indicators shaping estimates, Nonfarm Payrolls tend to surprise markets and trigger substantial volatility. Actual figures beating the consensus tend to be USD bullish.
Author

Joaquin Monfort
FXStreet
Joaquin Monfort is a financial writer and analyst with over 10 years experience writing about financial markets and alt data. He holds a degree in Anthropology from London University and a Diploma in Technical analysis.


