Gold loses ground after strong US Nonfarm Payrolls data
- Gold falls after better-than-expected US Nonfarm Payrolls shows the US labor market is healthy.
- The 254K increase in the headline payrolls figure reduces bets of a 50 bps rate cut in November – driving Gold lower.
- Technically, XAU/USD is consolidating in a medium and long-term uptrend.

Gold (XAU/USD) weakens into the $2,650s on Friday as traders sell the asset and the US Dollar strengthens on the back of strong US labor market data. The US Nonfarm Payrolls (NFP) report for September showed an improvement in almost all employment metrics, including payrolls themselves, the Unemployment Rate and Average Hourly Earnings.
The US Bureau of Labor Statistics' (BLS) Nonfarm Payrolls (NFP) report showed 254K new employees joined the US workforce in September, which was higher than the upwardly-revised 159K in August, and beat estimates of 140K.
The US Unemployment Rate, meanwhile, fell to 4.1%, which was below the 4.2% of August, and the 4.2% expected.
Average Hourly Earnings in the US rose 4.0% annually from a revised-up 3.9% in August and was above expectations of 3.8%.
On a monthly basis Average Hourly Earnings rose by 0.4% from the upwardly-revised 0.5% MoM in August and was above the 0.3% forecast by economists.
The data indicates the US labor market is in much better shape than expected and means the Federal Reserve (Fed) is less likely to implement a double-dose 50 basis points (bps) (0.5%) rate cut at the November meeting. This in turn, is negative for non-interest paying Gold, as it increases the opportunity cost of holding the yellow metal vis-a-vis other assets.
Gold benefits from safe-haven demand
Gold may see downside limited, however, by support from safe-haven flows due to concerns about an escalation of the conflict in the Middle East. Israel is widely expected to launch an imminent retaliatory attack on Iran for its bombardment on Tuesday evening. Iran launched around 200 missiles, many of them ballistic, to avenge the death of Hassan Nasrallah, the head of the Iran-backed group Hezbollah.
The yellow metal is further supported by the overall trend lower in global interest rates, which enables Gold to retain its attractiveness as a portfolio asset for investors.
Technical Analysis: Gold tilts lower within range
Gold falls within its sideways trend. It has breaks below the 50-period Simple Moving Average (SMA) on the 4-hour chart (below), suggesting a bearish tilt to the short-term outlook.
Gold pulls back slightly from the range floor of $2.638 (October 3 low) and a major trendline – a close below these support levels would turn the short-term trend more bearish and increase the odds of more downside following. XAU/USD 4-hour Chart
Gold 4-hour Chart
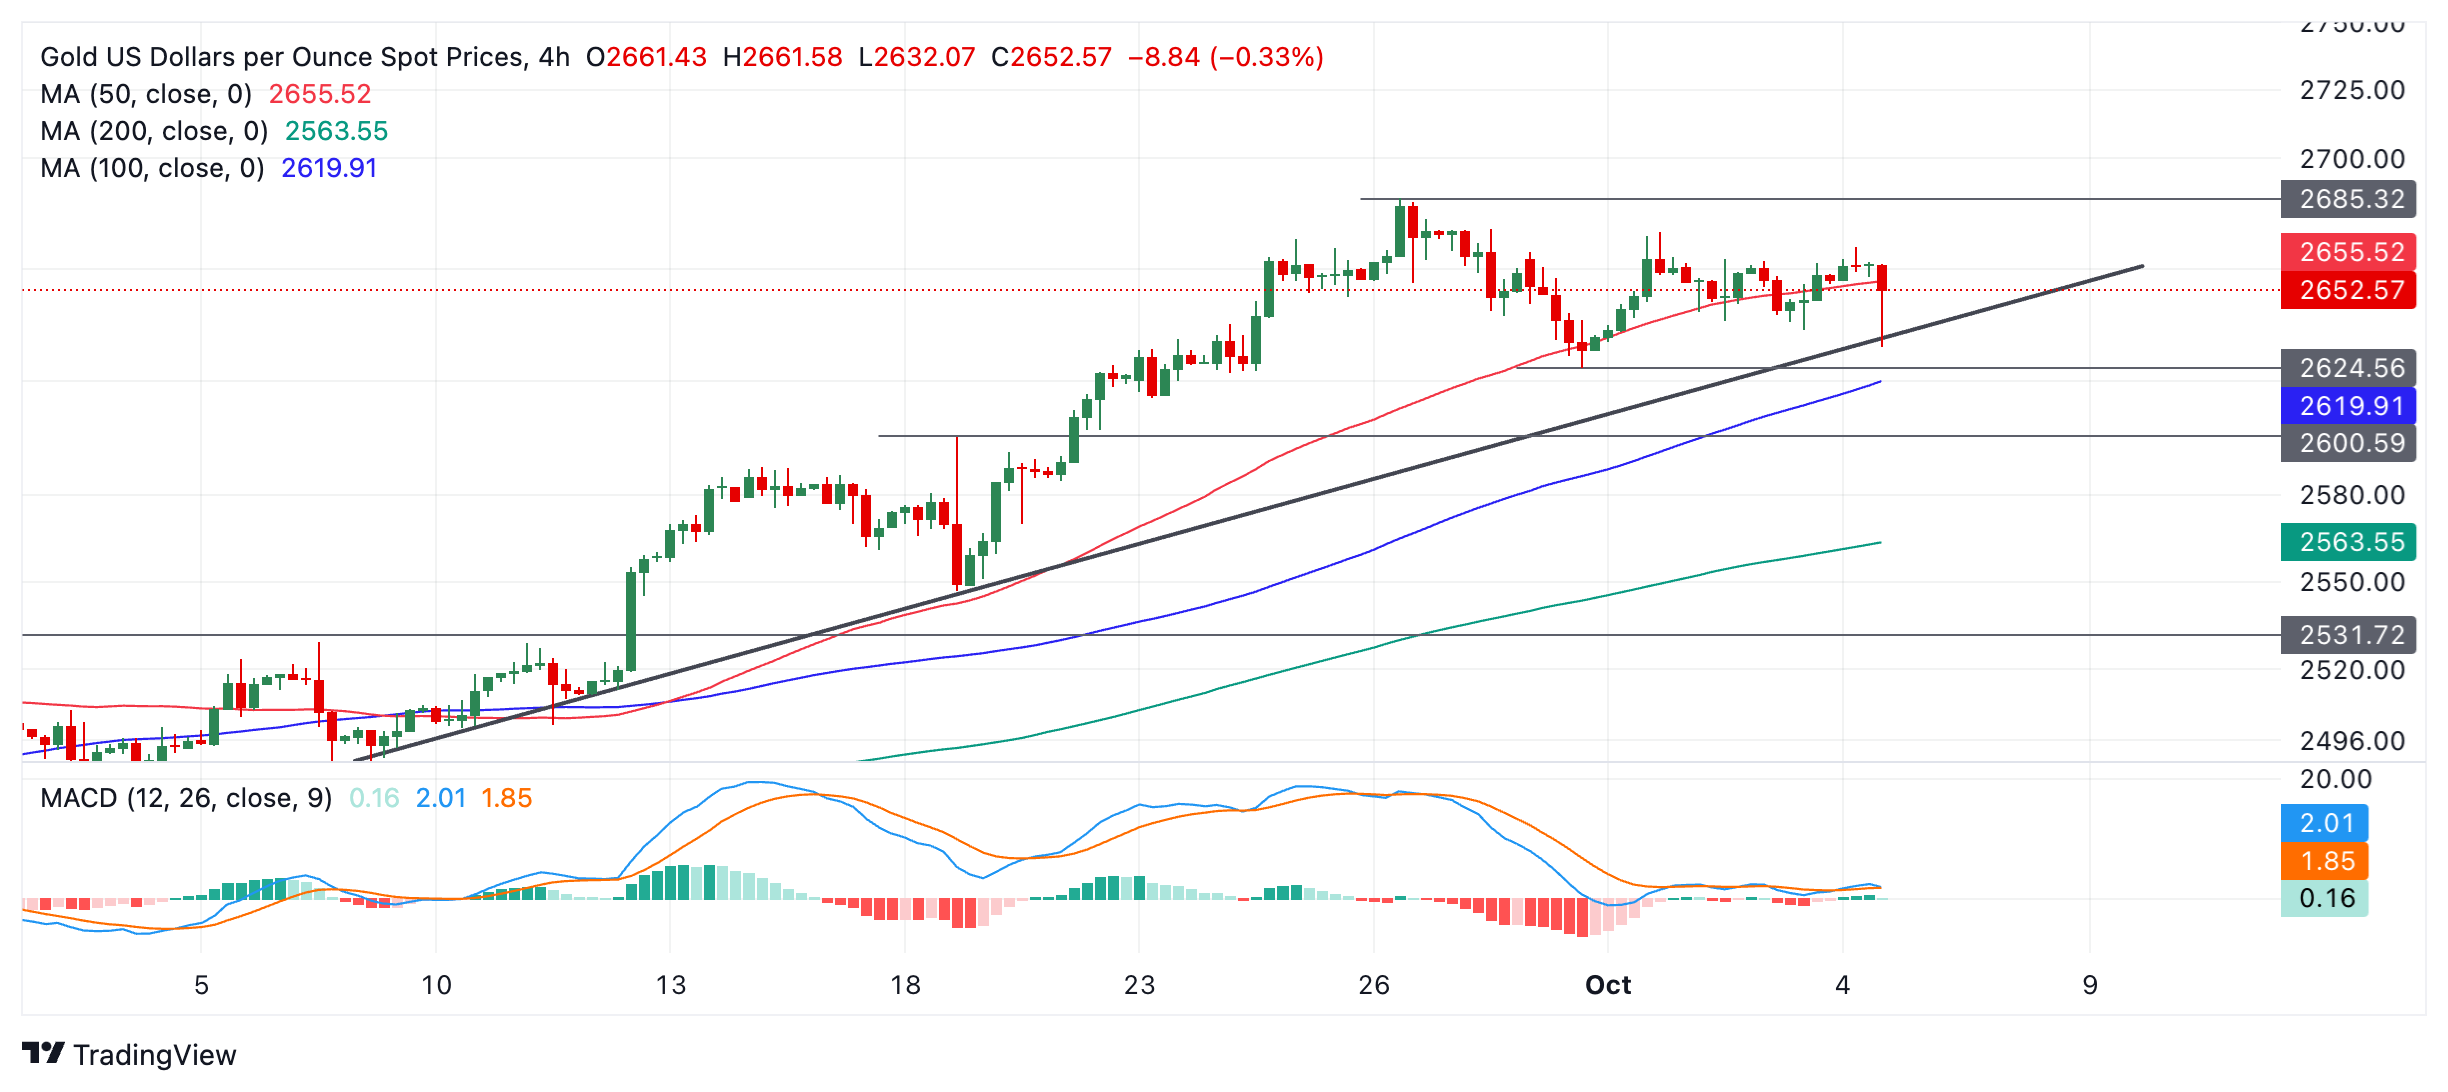
As long as XAU/USD remains within the paramenters of the range, the short-term trend is sideways, and given the technical analysis principle that “the trend is your friend,” it is more likely than not to endure with price oscillating between poles.
It would require a breakout either above the top of the range at $2,673 or below the bottom to confirm a new directional bias.
A break below $2.638 would lead to a move down to at least the swing low of $2,625 (September 30 low). A break below that would likely see prices give way to support at $2,600 (August 20 high, round number).
A break above $2,673 would increase the odds of a resumption of the old uptrend, probably leading to a continuation up to the round-number target at $2,700.
On a medium and long-term basis, Gold remains in an uptrend, with the odds favoring an eventual resumption higher once the current period of consolidation has ended.
Economic Indicator
Unemployment Rate
The Unemployment Rate, released by the US Bureau of Labor Statistics (BLS), is the percentage of the total civilian labor force that is not in paid employment but is actively seeking employment. The rate is usually higher in recessionary economies compared to economies that are growing. Generally, a decrease in the Unemployment Rate is seen as bullish for the US Dollar (USD), while an increase is seen as bearish. That said, the number by itself usually can't determine the direction of the next market move, as this will also depend on the headline Nonfarm Payroll reading, and the other data in the BLS report.
Read more.Author

Joaquin Monfort
FXStreet
Joaquin Monfort is a financial writer and analyst with over 10 years experience writing about financial markets and alt data. He holds a degree in Anthropology from London University and a Diploma in Technical analysis.

















