Gold rebounds after US Manufacturing ISM data shows contraction in May
- Gold recovers from three-week lows after negative US ISM Manufacturing data and fall in US yields.
- Asian demand and cooling inflation expectations further support Gold's bounce.
- Technicals remain bearish after a breakout from a Bear Flag.

Gold (XAU/USD) recovers to trade in the $2,340s on Monday after the release of US ISM Manufacturing PMI data shows a greater-than-expected contraction in May, increasing bets the Federal Reserve (Fed) will lower interest rates as the US economy cools.
The ISM Manufacturing PMI contracted to 48.7 in May, which was below the 49.6 expected and 49.2 in April, according to data from the Institute of Supply Management (ISM)., released on Monday The data led to a increase in market-based probabilities the Fed will cut interest rates in September. Prior to the release, the CME FedWatch tool had given the chances of a September cut about 55% and after the release that had risen to 59%.
The expectation of lower interest rates is positive for Gold as it reduces the opportunity cost of holding the precious metal.
Gold to be supported during the summer
Gold is likely to be supported during the summer as investors weigh the odds of future interest rate moves from major central banks and Asian demand stays bouyant, according to Bart Malek, Head of Commodity Strategy at TD Securities.
Whilst Gold tumbled from all-time highs in April after the Fed signaled it would be delaying expected interest-rate cuts indefinitely, it has found a floor as speculators have short-covered following a poor run of US data including Friday’s core PCE undershoot. Thus the metal is both capped and supported, suggests the strategist.
“Considering that the Fed's favorite inflation measure is showing a consistent move lower, the Gold market should be well supported through the summer. But, since policy makers will need more proof that their economic modeling is reflecting reality and that rates are indeed restrictive sufficiently to control inflation, no large rally is expected for now. Gold moves and investor positioning will very much be data dependent,” says Malek.
Gold is further supported by Asian buying as a hedge against currency depreciation. Most recently Chinese buying has been noted as a counter-weight against the devaluation of the Renminbi, adds Malek.
Technical Analysis: Gold makes lower lows
Gold price broke out of a rectangular consolidation (red-shaded area in the chart below) – probably a Bear Flag continuation price pattern – on May 29. Bear flags are like upside-down flags with a steep decline – the “flagpole” – followed by a rectangle or square price consolidation – the “flag square”.
The breakout of the flag square activated the Bear Flag’s downside target at $2,295 (the 0.618 Fibonacci extrapolation of the flagpole that formed from May 21-23).
The target for the break below the trendline lies nearby at $2,303 (the 0.618 Fib. extrapolation of the down-move prior to the break).
Gold has step-declined to lower lows since then, providing further bearish confirmation following the breakout. Recently bears managed to push the price down to $2,314, only $11 away from the first downside target.
XAU/USD 4-hour Chart
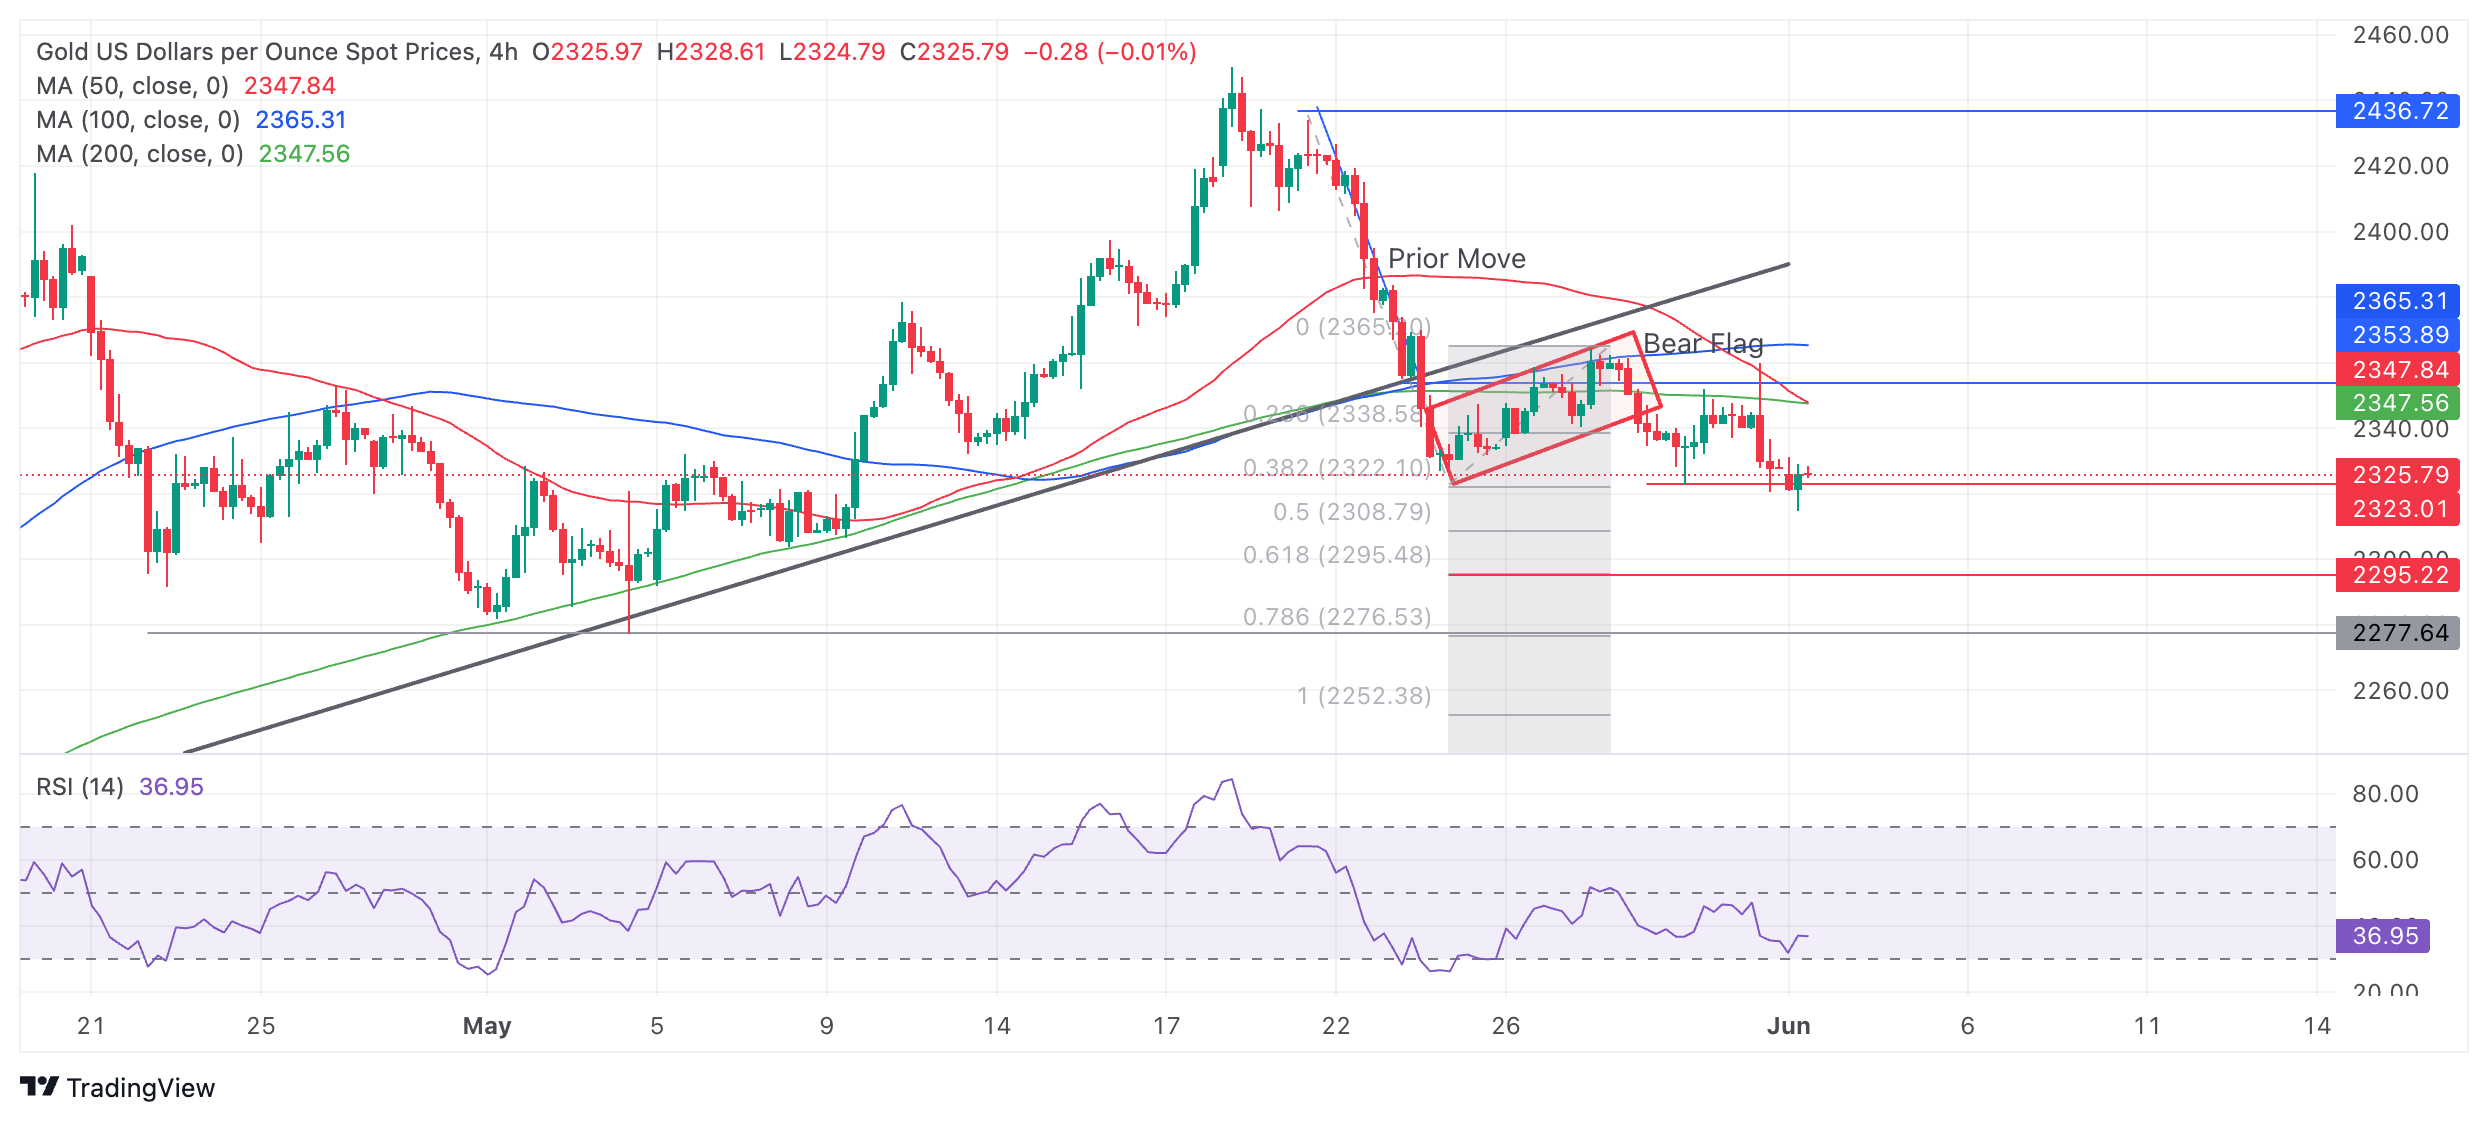
Gold's 4-hour chart now exhibits a sequence of declining peaks and troughs and a major trendline break, suggesting the precious metal is in a short-term downtrend and favoring short positions over longs.
More bearish moves could very well be on the way, suggesting Gold could even fall to $2,272-$2,277 (the 100% extrapolatin of the move prior to the trend-line break, historical support and resistance).
The precious metal’s medium and long-term trends are still bullish, however, and the risk of a recovery remains high. That said, price action is not supporting a resumption hypothesis at the moment.
A break above the peak of the rectangular consolidation zone at $2,362 would be required to bring into doubt the integrity of the short-term downtrend, otherwise further weakness is foreseen.
Gold FAQs
Gold has played a key role in human’s history as it has been widely used as a store of value and medium of exchange. Currently, apart from its shine and usage for jewelry, the precious metal is widely seen as a safe-haven asset, meaning that it is considered a good investment during turbulent times. Gold is also widely seen as a hedge against inflation and against depreciating currencies as it doesn’t rely on any specific issuer or government.
Central banks are the biggest Gold holders. In their aim to support their currencies in turbulent times, central banks tend to diversify their reserves and buy Gold to improve the perceived strength of the economy and the currency. High Gold reserves can be a source of trust for a country’s solvency. Central banks added 1,136 tonnes of Gold worth around $70 billion to their reserves in 2022, according to data from the World Gold Council. This is the highest yearly purchase since records began. Central banks from emerging economies such as China, India and Turkey are quickly increasing their Gold reserves.
Gold has an inverse correlation with the US Dollar and US Treasuries, which are both major reserve and safe-haven assets. When the Dollar depreciates, Gold tends to rise, enabling investors and central banks to diversify their assets in turbulent times. Gold is also inversely correlated with risk assets. A rally in the stock market tends to weaken Gold price, while sell-offs in riskier markets tend to favor the precious metal.
The price can move due to a wide range of factors. Geopolitical instability or fears of a deep recession can quickly make Gold price escalate due to its safe-haven status. As a yield-less asset, Gold tends to rise with lower interest rates, while higher cost of money usually weighs down on the yellow metal. Still, most moves depend on how the US Dollar (USD) behaves as the asset is priced in dollars (XAU/USD). A strong Dollar tends to keep the price of Gold controlled, whereas a weaker Dollar is likely to push Gold prices up.
Author

Joaquin Monfort
FXStreet
Joaquin Monfort is a financial writer and analyst with over 10 years experience writing about financial markets and alt data. He holds a degree in Anthropology from London University and a Diploma in Technical analysis.


