Gold price refreshes daily low as receding safe-haven demand offsets subdued USD price action
- Gold price snaps a four-day winning streak to a two-week high set on Tuesday.
- A positive risk tone and a modest USD uptick undermine the precious metal.
- Rising Fed rate cut bets might cap the Greenback and support the commodity.

Gold price (XAU/USD) drops to a fresh daily low during the first half of the European session and, for now, seems to have snapped a four-day winning streak, reaching a nearly two-week high touched the previous day. The risk-on mood – as depicted by a generally positive tone around the equity markets – is seen as a key factor driving flows away from the safe-haven precious metal. That said, a combination of supporting factors could help limit losses for the commodity and warrants caution for bearish traders.
Weaker-than-expected US Nonfarm Payrolls (NFP) report released last Friday, along with Tuesday's disappointing US ISM Services PMI, fueled concerns about the health of the world's largest economy. This, in turn, reaffirms market bets that the US Federal Reserve (Fed) will resume its rate-cutting cycle in September, which keeps the US Dollar (USD) bulls on the defensive and should act as a tailwind for the non-yielding Gold price. Apart from this, trade-related uncertainty could lend support.
Daily Digest Market Movers: Gold price intraday selling remains unabated amid risk-on mood
- Asia equity markets mostly rose on Wednesday as investors assessed the disappointing US macro data, which fueled economic worries and pushed Wall Street lower on Tuesday. In fact, the Institute for Supply Management (ISM) reported that its Services Purchasing Managers' Index (PMI) slipped to 50.1 in July from 50.8 in the previous month.
- Additional details of the report showed that the Employment Index ticked lower to 46.4 from 47.2, and the New Orders Index deflated to 50.3 during the reported month from 51.3 in June. This comes on top of softer July US jobs data and underscores the ongoing drag on the economy amid the uncertainty over US President Donald Trump's trade policies.
- Nevertheless, traders have ramped up their bets that the Federal Reserve will lower borrowing costs at the September policy meeting and are pricing in the possibility of more than two 25-basis-point rate cuts by the end of this year. This fails to assist the US Dollar in attracting any meaningful buyers and should act as a tailwind for the non-yielding Gold price.
- On the trade-related front, Trump announced that US tariffs on semiconductor and pharmaceutical imports will be imposed within the next week or so. Moreover, the Trump administration has already imposed levies on imports of cars and auto parts as well as steel and aluminum. This keeps investors on edge and should further support the commodity.
- There isn't any relevant market-moving economic data due for release from the US on Wednesday, leaving the USD at the mercy of comments from influential FOMC members. Apart from this, the broader risk sentiment could drive the safe-haven XAU/USD and produce trading opportunities ahead of the latest US inflation figures next week.
Gold price needs to weaken below 100-SMA support on H4 to negate any near-term positive outlook
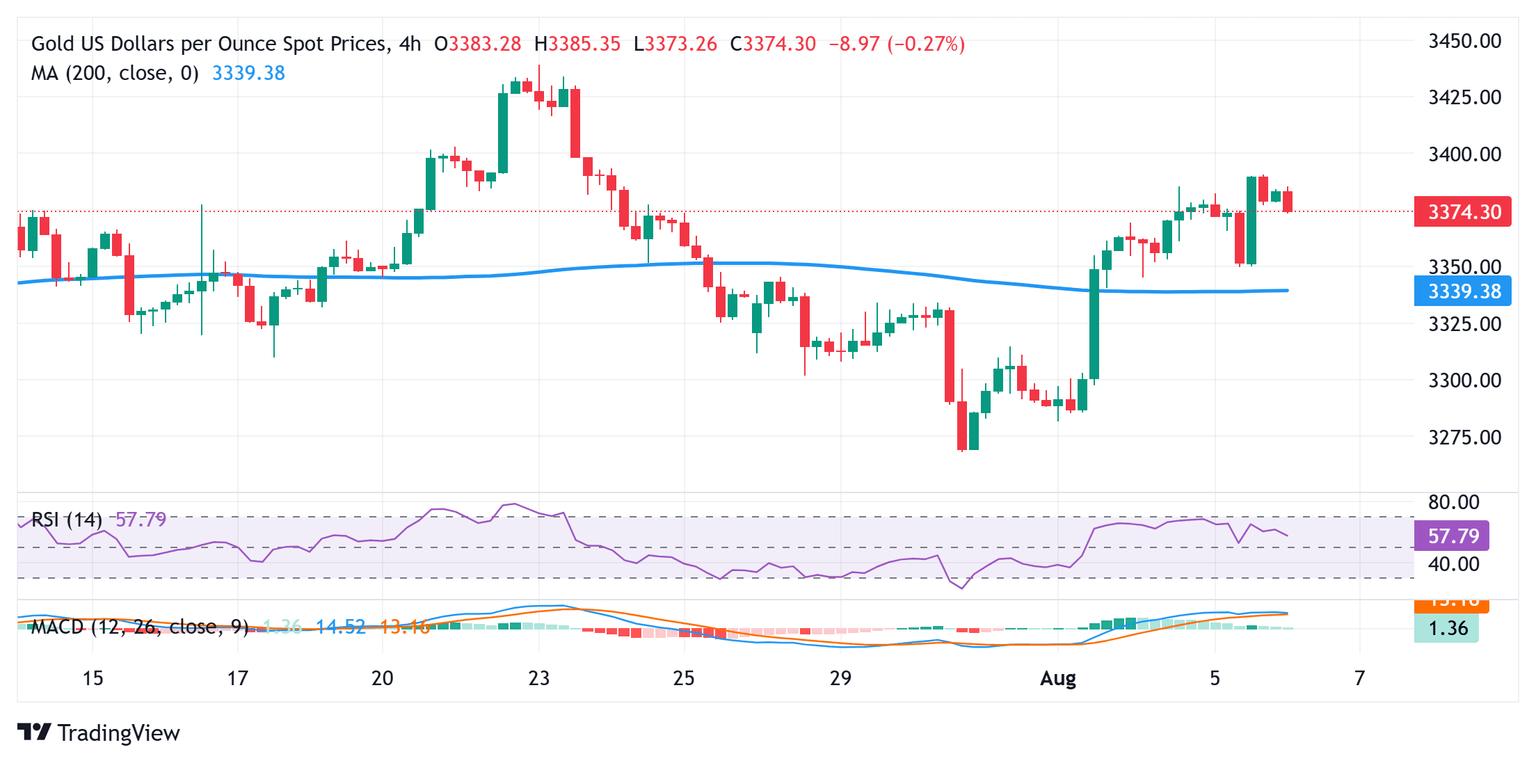
From a technical perspective, the overnight bounce from the 100-period Simple Moving Average on the 4-hour chart, along with positive oscillators on hourly/daily charts, favors the XAU/USD bulls. That said, Wednesday's failure ahead of the $3,400 mark makes it prudent to wait for a sustained strength beyond the said handle before positioning for any further gains. The subsequent move up could lift the Gold price to the $3,434-3,435 pivotal resistance, which, if cleared decisively, will set the stage for a retest of the all-time peak, around the $3,500 psychological mark touched in April.
On the flip side, the $3,350 area, or the 100-period SMA on the 4-hour chart, should continue to act as an immediate strong support. A convincing break below, however, might prompt some technical selling and make the Gold price vulnerable to accelerate the slide towards the $3,322 intermediate support en route to the $3,300 round figure. Acceptance below the latter would expose the $3,268 region, or a one-month low touched last week.
US Dollar PRICE Today
The table below shows the percentage change of US Dollar (USD) against listed major currencies today. US Dollar was the strongest against the Japanese Yen.
| USD | EUR | GBP | JPY | CAD | AUD | NZD | CHF | |
|---|---|---|---|---|---|---|---|---|
| USD | -0.04% | 0.08% | 0.09% | -0.03% | -0.35% | -0.22% | 0.06% | |
| EUR | 0.04% | 0.10% | 0.15% | -0.00% | -0.22% | -0.22% | 0.10% | |
| GBP | -0.08% | -0.10% | 0.04% | -0.09% | -0.33% | -0.34% | 0.05% | |
| JPY | -0.09% | -0.15% | -0.04% | -0.13% | -0.48% | -0.42% | 0.02% | |
| CAD | 0.03% | 0.00% | 0.09% | 0.13% | -0.22% | -0.24% | 0.14% | |
| AUD | 0.35% | 0.22% | 0.33% | 0.48% | 0.22% | -0.01% | 0.37% | |
| NZD | 0.22% | 0.22% | 0.34% | 0.42% | 0.24% | 0.00% | 0.38% | |
| CHF | -0.06% | -0.10% | -0.05% | -0.02% | -0.14% | -0.37% | -0.38% |
The heat map shows percentage changes of major currencies against each other. The base currency is picked from the left column, while the quote currency is picked from the top row. For example, if you pick the US Dollar from the left column and move along the horizontal line to the Japanese Yen, the percentage change displayed in the box will represent USD (base)/JPY (quote).
Author

Haresh Menghani
FXStreet
Haresh Menghani is a detail-oriented professional with 10+ years of extensive experience in analysing the global financial markets.


