Gold price extends losses ahead of US GDP data
- Gold price loses traction in Thursday’s Asian session.
- The downtick of the yellow metal is backed by the stronger USD and higher US yields.
- Gold traders await the US Q1 GDP data for fresh impetus and monitor the Middle East geopolitical risks.

Gold price (XAU/USD) trades in negative territory on Thursday, supported by the firmer US Dollar (USD) and higher US yields. The diminishing expectation of the Federal Reserve's (Fed) rate cut in September exerts some selling pressure on the precious metal as it will increase gold's opportunity costs.
Investors will monitor the second estimate of the US Gross Domestic Product (GDP) for Q1 2024 on Thursday. In the event that the US economy shows a stronger-than-expected reading, this might further lift the USD and weigh on the USD-denominated gold price. Nonetheless, the ongoing geopolitical tensions in the Middle East might boost traditional safe-haven assets like gold. Also, the rising demand from the central bank might cap the downside for yellow metal in the near term.
Daily Digest Market Movers: Gold price remains weak amid stronger US data
- The Israeli military said on Wednesday that it established “operational control” over the Philadelphi Corridor, a 14-kilometer (8.7 miles) strip of land along the border between Gaza and Egypt, per CNN.
- Global physically-backed gold Exchange-Traded Funds (ETFs) witnessed a net outflow of 11.3 metric tonnes last week, according to the World Gold Council.
- Fed Atlanta President Bostic said on Thursday that the breadth of price gains is still significant, but less inflation breadth would add to confidence for a rate cut.
- Economic activity continued to expand in the US and prices increased modestly from early April to mid-May. Overall outlooks were more pessimistic amid reports of rising uncertainty and greater downside risks, according to the Fed's Beige Book released Wednesday.
- Markets are pricing in a 50% chance that the Fed will hold interest rates in September, according to the CME FedWatch Tool.
- The US Gross Domestic Product (GDP) number is estimated to expand at a 1.3% annual pace in the first quarter of 2024.
Technical analysis: Gold price keeps the bullish vibe in the long term
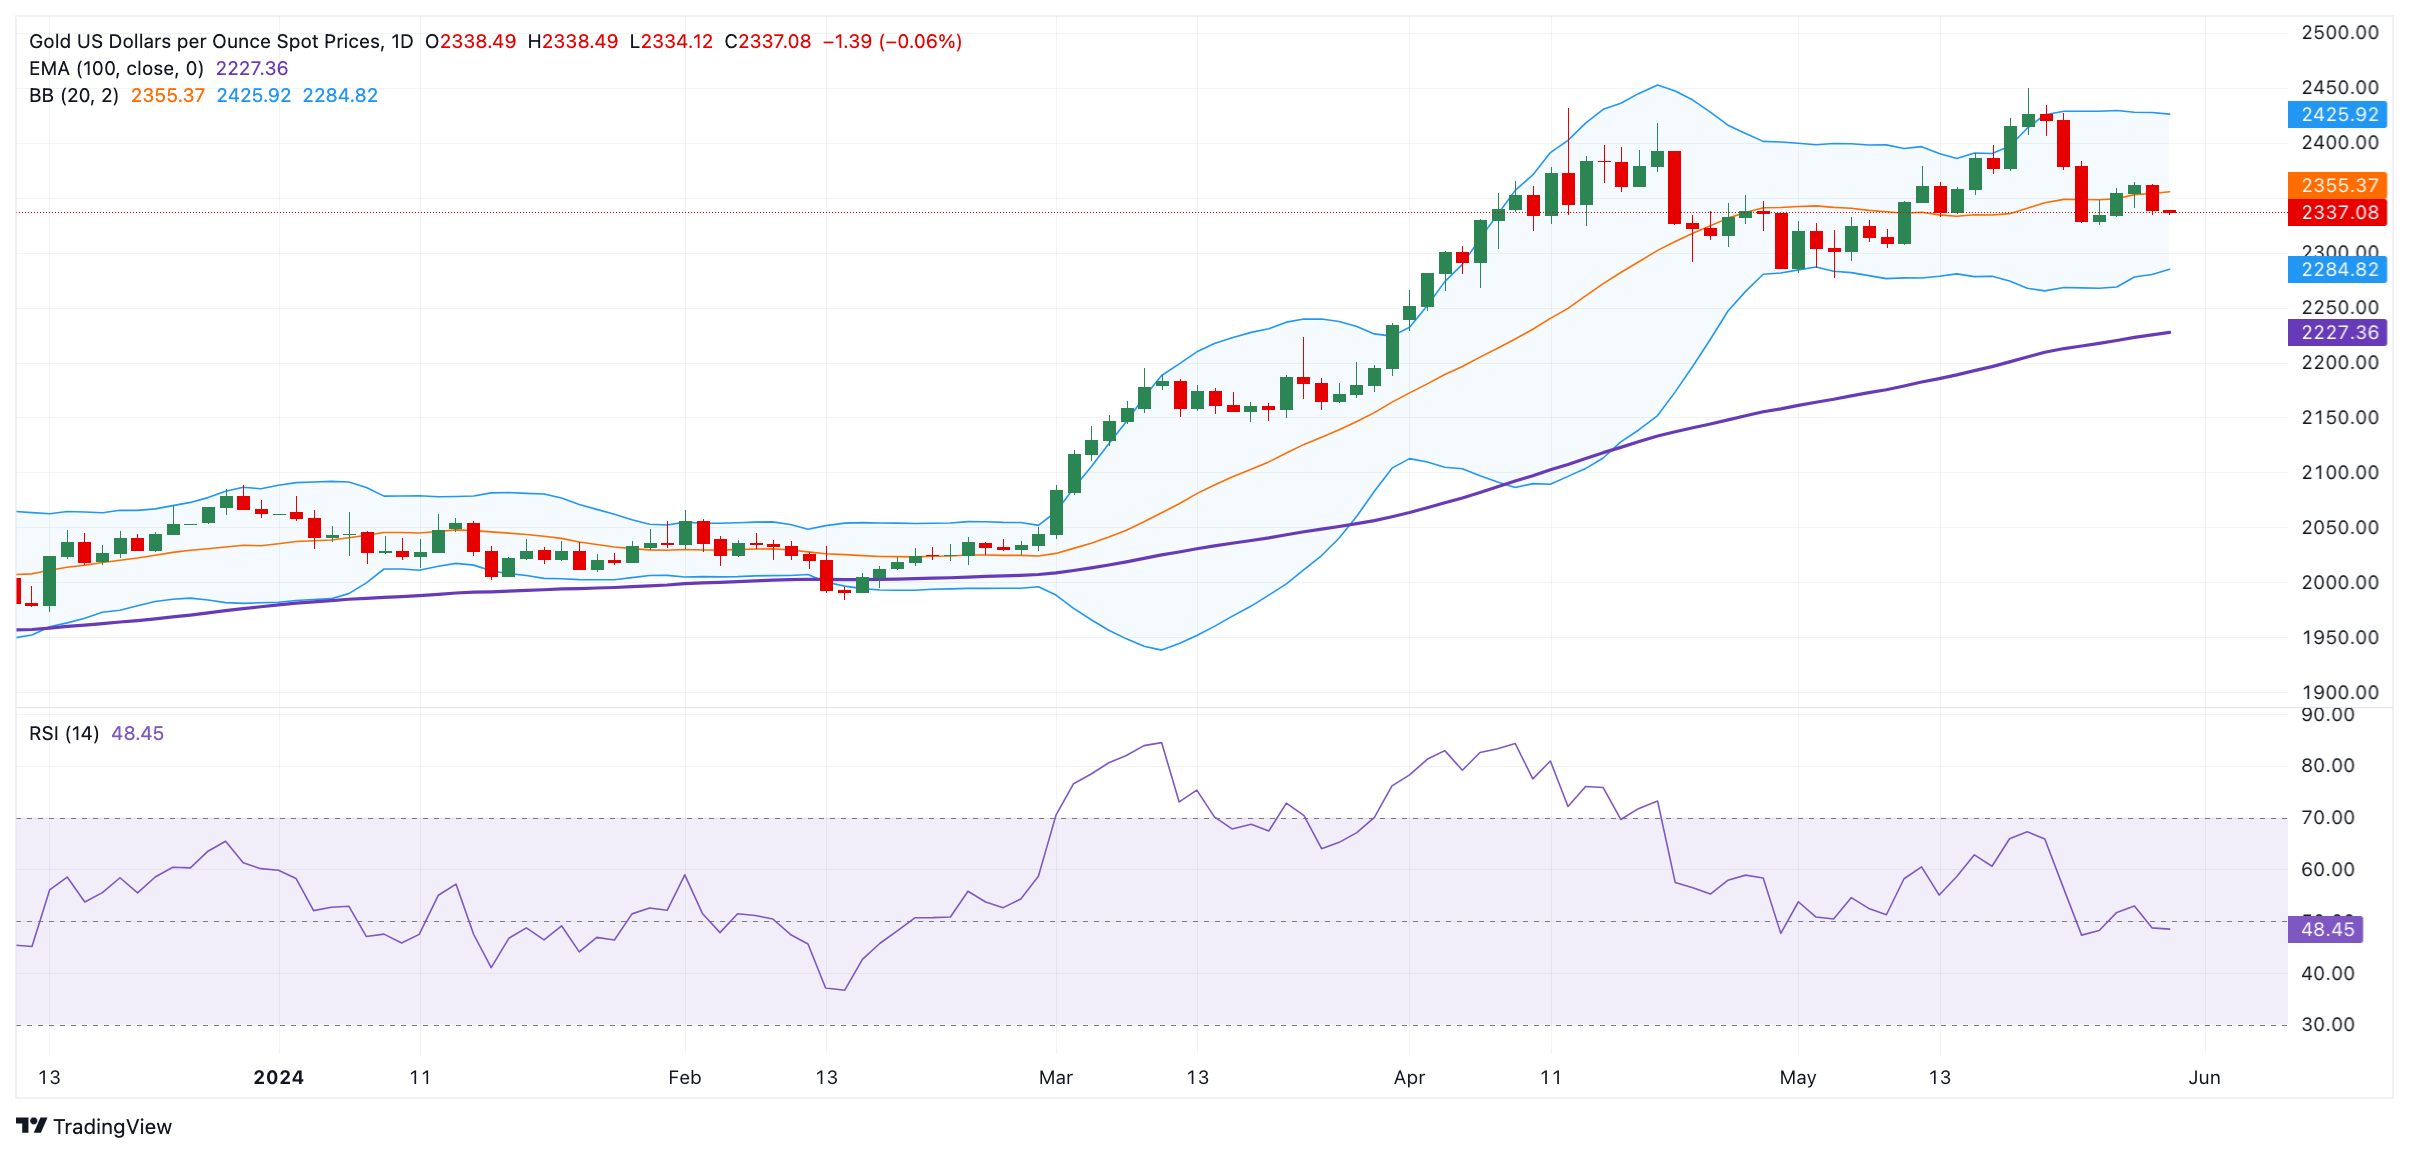
The gold price trades with negative bias on the day. According to the 1-hour chart, the precious metal stays bullish above the key 100-day Exponential Moving Average (EMA). However, the further consolidation or directionlessness of the yellow metal cannot be ruled out as the 14-day Relative Strength Index (RSI) hovers around the 50-midline, indicating a neutral level between bullish and bearish positions.
Extended gains above the upper boundary of the Bollinger Band at $2,425 might visit the all-time high of $2,450. An upside breakout above the mentioned level will pave the way to the $2,500 psychological mark.
On the downside, the first downside target of XAU/USD is located at a low of May 24 at $2,325. The potential support level will emerge at the $2,300 figure. A breach of this level will see a drop to the lower limit of the Bollinger Band at $2,284, followed by the 100-day EMA of $2,227.
US Dollar price today
The table below shows the percentage change of US Dollar (USD) against listed major currencies today. US Dollar was the strongest against the New Zealand Dollar.
| USD | EUR | GBP | CAD | AUD | JPY | NZD | CHF | |
| USD | 0.06% | 0.02% | 0.04% | 0.13% | -0.26% | 0.21% | -0.02% | |
| EUR | -0.06% | -0.04% | -0.01% | 0.06% | -0.31% | 0.15% | -0.10% | |
| GBP | -0.02% | 0.04% | 0.04% | 0.10% | -0.28% | 0.19% | -0.07% | |
| CAD | -0.06% | 0.01% | -0.02% | 0.09% | -0.31% | 0.15% | -0.10% | |
| AUD | -0.12% | -0.08% | -0.10% | -0.08% | -0.37% | 0.09% | -0.16% | |
| JPY | 0.25% | 0.31% | 0.26% | 0.27% | 0.38% | 0.46% | 0.21% | |
| NZD | -0.22% | -0.15% | -0.19% | -0.16% | -0.09% | -0.45% | -0.26% | |
| CHF | 0.02% | 0.09% | 0.05% | 0.08% | 0.17% | -0.22% | 0.24% |
The heat map shows percentage changes of major currencies against each other. The base currency is picked from the left column, while the quote currency is picked from the top row. For example, if you pick the Euro from the left column and move along the horizontal line to the Japanese Yen, the percentage change displayed in the box will represent EUR (base)/JPY (quote).
Gold FAQs
Gold has played a key role in human’s history as it has been widely used as a store of value and medium of exchange. Currently, apart from its shine and usage for jewelry, the precious metal is widely seen as a safe-haven asset, meaning that it is considered a good investment during turbulent times. Gold is also widely seen as a hedge against inflation and against depreciating currencies as it doesn’t rely on any specific issuer or government.
Central banks are the biggest Gold holders. In their aim to support their currencies in turbulent times, central banks tend to diversify their reserves and buy Gold to improve the perceived strength of the economy and the currency. High Gold reserves can be a source of trust for a country’s solvency. Central banks added 1,136 tonnes of Gold worth around $70 billion to their reserves in 2022, according to data from the World Gold Council. This is the highest yearly purchase since records began. Central banks from emerging economies such as China, India and Turkey are quickly increasing their Gold reserves.
Gold has an inverse correlation with the US Dollar and US Treasuries, which are both major reserve and safe-haven assets. When the Dollar depreciates, Gold tends to rise, enabling investors and central banks to diversify their assets in turbulent times. Gold is also inversely correlated with risk assets. A rally in the stock market tends to weaken Gold price, while sell-offs in riskier markets tend to favor the precious metal.
The price can move due to a wide range of factors. Geopolitical instability or fears of a deep recession can quickly make Gold price escalate due to its safe-haven status. As a yield-less asset, Gold tends to rise with lower interest rates, while higher cost of money usually weighs down on the yellow metal. Still, most moves depend on how the US Dollar (USD) behaves as the asset is priced in dollars (XAU/USD). A strong Dollar tends to keep the price of Gold controlled, whereas a weaker Dollar is likely to push Gold prices up.
Author

Lallalit Srijandorn
FXStreet
Lallalit Srijandorn is a Parisian at heart. She has lived in France since 2019 and now becomes a digital entrepreneur based in Paris and Bangkok.