Gold price slips below $2,900 as USD rebounds from multi-month low
- Gold price attracts some sellers on Monday amid a modest USD bounce from a multi-month low.
- Worries about Trump‘s trade policies and Fed rate cut bets should lend support to the commodity.
- The recent range-bound price action also warrants caution before placing fresh directional bets.

Gold price (XAU/USD) slips below the $2,900 mark during the first half of the European session on Monday and moves back closer to the lower end of a nearly one-week-old trading range. As investors look past Friday's weaker US jobs report, the US Dollar (USD) stages a modest bounce from its lowest level since November and turns out to be a key factor undermining the precious metal.
However, bets that the Federal Reserve (Fed) will cut interest rates multiple times this year and a steep intraday decline in the US Treasury bond yields might hold back the USD bulls from placing fresh bets. Furthermore, worries about the economic fallout from US President Donald Trump's trade tariffs and global trade war fears could offer some support to the safe-haven Gold price and help limit losses.
Daily Digest Market Movers: Gold price drifts lower amid rebounding USD; fundamental backdrop warrants caution for bears
- The uncertainty surrounding US President Donald Trump's trade policies keeps investors on the edge and continues to act as a tailwind for the Gold price at the start of a new week. Moreover, investors remain worried that Trump's protectionist tariffs could slow the US economic growth and force the Federal Reserve to resume its rate-cutting cycle in June.
- In fact, Trump took another pivot on his tariff agenda and said that impending tariffs on Canada may or may not come on Monday, or on Tuesday. This comes a day after the Trump administration temporarily waived off the 25% steep tariffs on goods from Canada and Mexico that comply with the US–Mexico–Canada Agreement for a month.
- Fed Chair Jerome Powell said on Friday that the uncertainty around Trump Administration policies and their economic effects remains high. Separately, San Francisco Fed President Mary Daly said late Sunday that rising uncertainty among businesses could dampen demand in the US economy but does not justify a change in the interest rates policy.
- Adding to this, the US monthly employment details released on Friday showed that the US labor market in the world's largest economy slowed last month and reaffirmed bets for further policy easing by the Fed. The headline Nonfarm Payrolls print came in to show that the economy added 151K jobs in February against the 160K consensus forecast.
- Moreover, the previous month's reading was revised down to 125K from 143K reported originally. Additional details of the report showed that the Unemployment Rate unexpectedly edged higher to 4.1% from 4.0% in January. This, to a larger extent, overshadowed a rise in the Average Hourly Earnings to 4% from 3.9% in January (revised from 4.1%).
- Traders are now pricing in about three rate cuts of 25 basis points each by the Fed by the end of this year. This, in turn, triggers a fresh leg down in the US Treasury bond yields, which keeps the USD bulls on the defensive. Despite the supporting factors, the non-yielding precious metal has been struggling to attract meaningful buyers, warranting caution for bulls.
Gold price could accelerate the intraday slide once the trading range support, around the $2,893 area is broken decisively
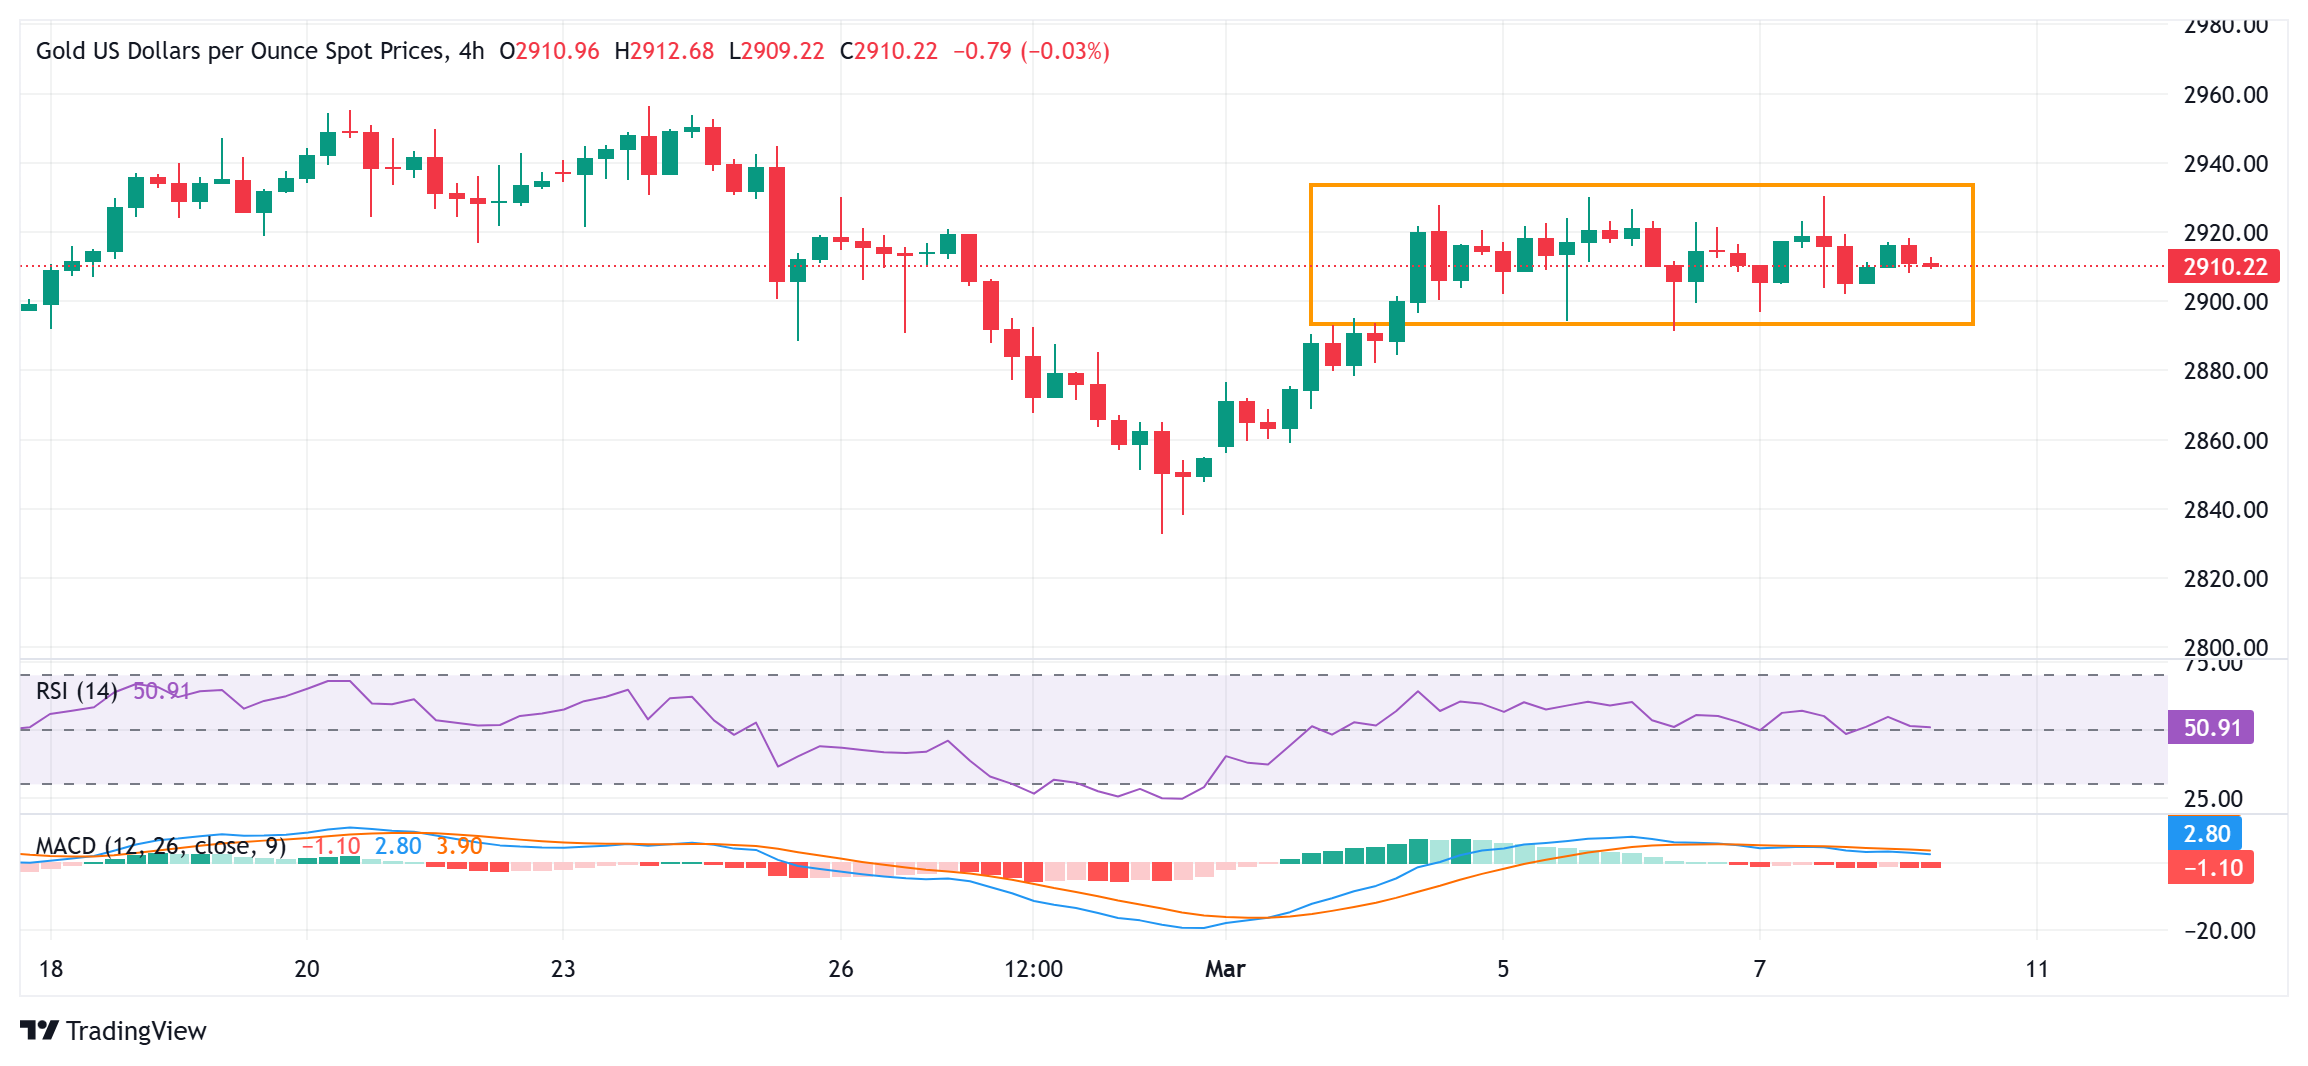
From a technical perspective, the Gold price has been showing some resilience below the $2,900 mark. Moreover, oscillators on the daily chart – though they have been losing traction – are still holding in positive territory. That said, the recent repeated failures to make it through the $2,925-2,930 supply zone make it prudent to wait for strong follow-through buying before placing fresh bullish bets. The XAU/USD might then aim to challenge the all-time peak, around the $2,956 region touched on February 24.
On the flip side, acceptance below the $2,900-2,895 horizontal zone might prompt some technical selling and drag the Gold price to the $2,860-2,858 horizontal zone. The downward trajectory could extend further towards the February 28 swing low, around the $2,833-2,832 area, before the XAU/USD eventually drops to the $2,800 round-figure mark.
US Dollar PRICE Today
The table below shows the percentage change of US Dollar (USD) against listed major currencies today. US Dollar was the strongest against the British Pound.
| USD | EUR | GBP | JPY | CAD | AUD | NZD | CHF | |
|---|---|---|---|---|---|---|---|---|
| USD | 0.22% | 0.33% | -0.53% | 0.08% | -0.11% | -0.16% | -0.19% | |
| EUR | -0.22% | 0.07% | -0.78% | -0.09% | -0.24% | -0.40% | -0.52% | |
| GBP | -0.33% | -0.07% | -0.91% | -0.23% | -0.31% | -0.53% | -0.52% | |
| JPY | 0.53% | 0.78% | 0.91% | 0.61% | 0.50% | 0.30% | 0.43% | |
| CAD | -0.08% | 0.09% | 0.23% | -0.61% | -0.23% | -0.24% | -0.30% | |
| AUD | 0.11% | 0.24% | 0.31% | -0.50% | 0.23% | -0.16% | -0.23% | |
| NZD | 0.16% | 0.40% | 0.53% | -0.30% | 0.24% | 0.16% | 0.05% | |
| CHF | 0.19% | 0.52% | 0.52% | -0.43% | 0.30% | 0.23% | -0.05% |
The heat map shows percentage changes of major currencies against each other. The base currency is picked from the left column, while the quote currency is picked from the top row. For example, if you pick the US Dollar from the left column and move along the horizontal line to the Japanese Yen, the percentage change displayed in the box will represent USD (base)/JPY (quote).
Author

Haresh Menghani
FXStreet
Haresh Menghani is a detail-oriented professional with 10+ years of extensive experience in analysing the global financial markets.


