|

Gold Price News and Forecast: XAU/USD prices crashed; be ready to sell a break below 1820

Gold bearish ABC pattern aiming at $1,700 support

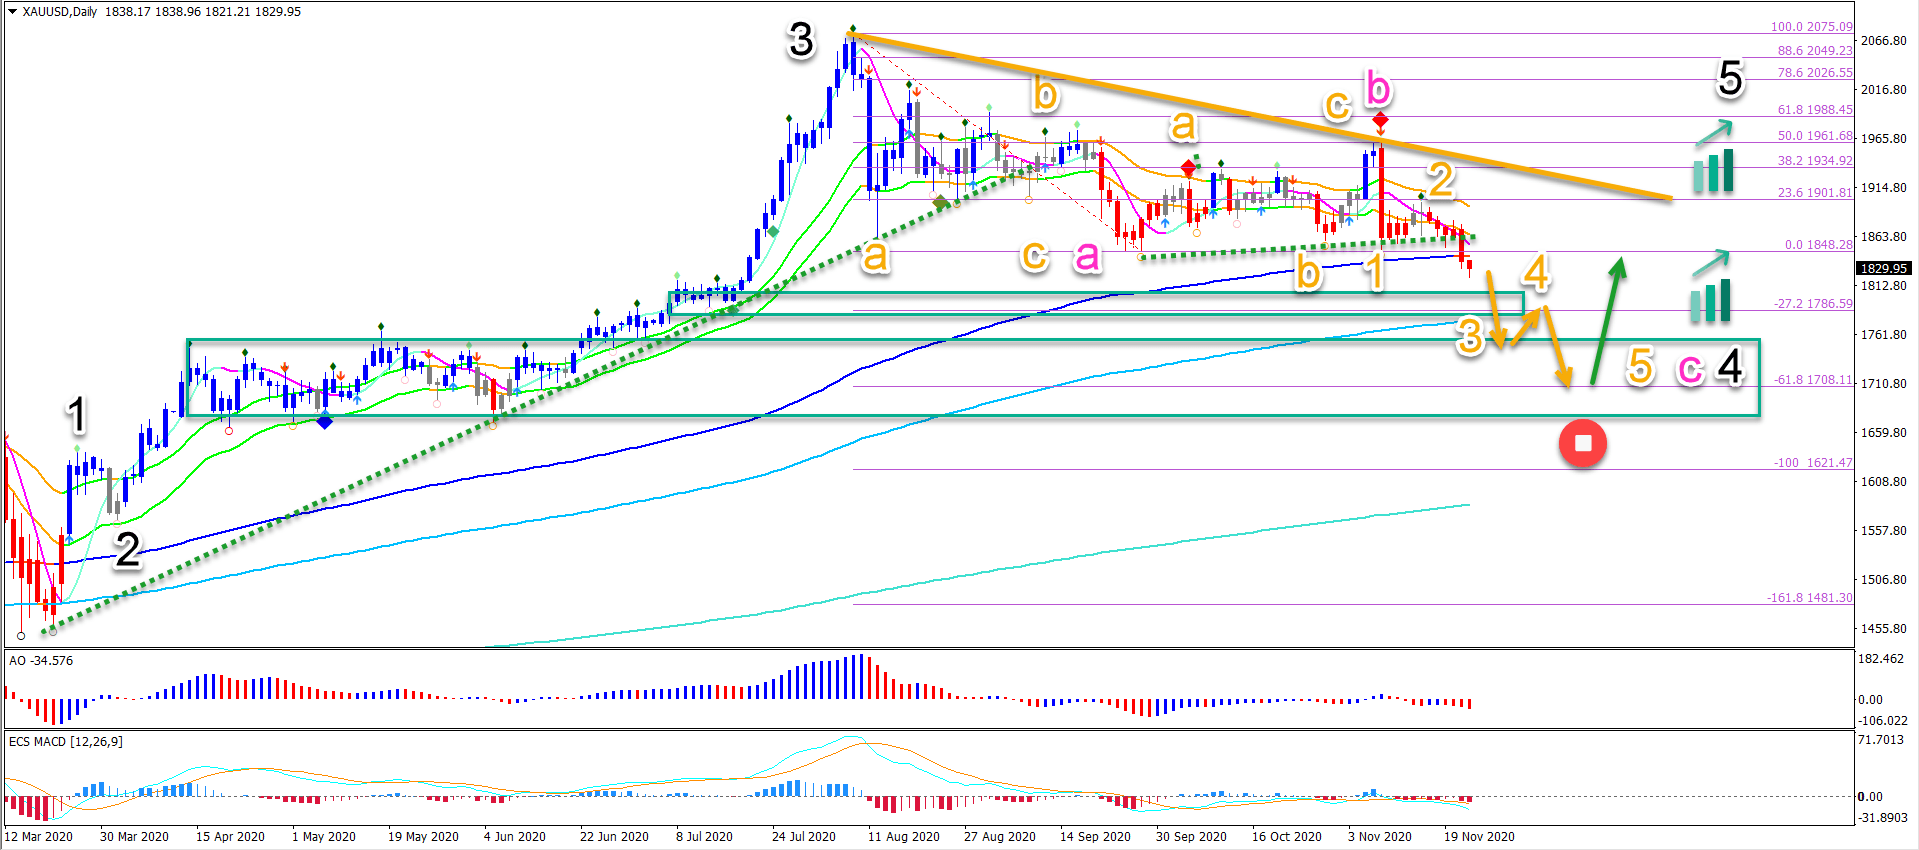
Gold (XAU/USD) is building a bull flag chart pattern (orange lines). Price action seems ready to break below the 21 ema zone. The main targets are the -27.2% and -61.8% Fibonacci targets.

The main target of XAU/USD with a bearish break below the 21 ema is the -61.8% Fibonacci. There is also a support zone and previous top (green box) which can stop price action from falling. A break below the support zone, however, would invalidate the uptrend (red circle). In that case, a reversal is taking place that could take the price much deeper. Read more...

Gold

Gold prices crashed; be ready to sell a break below 1820

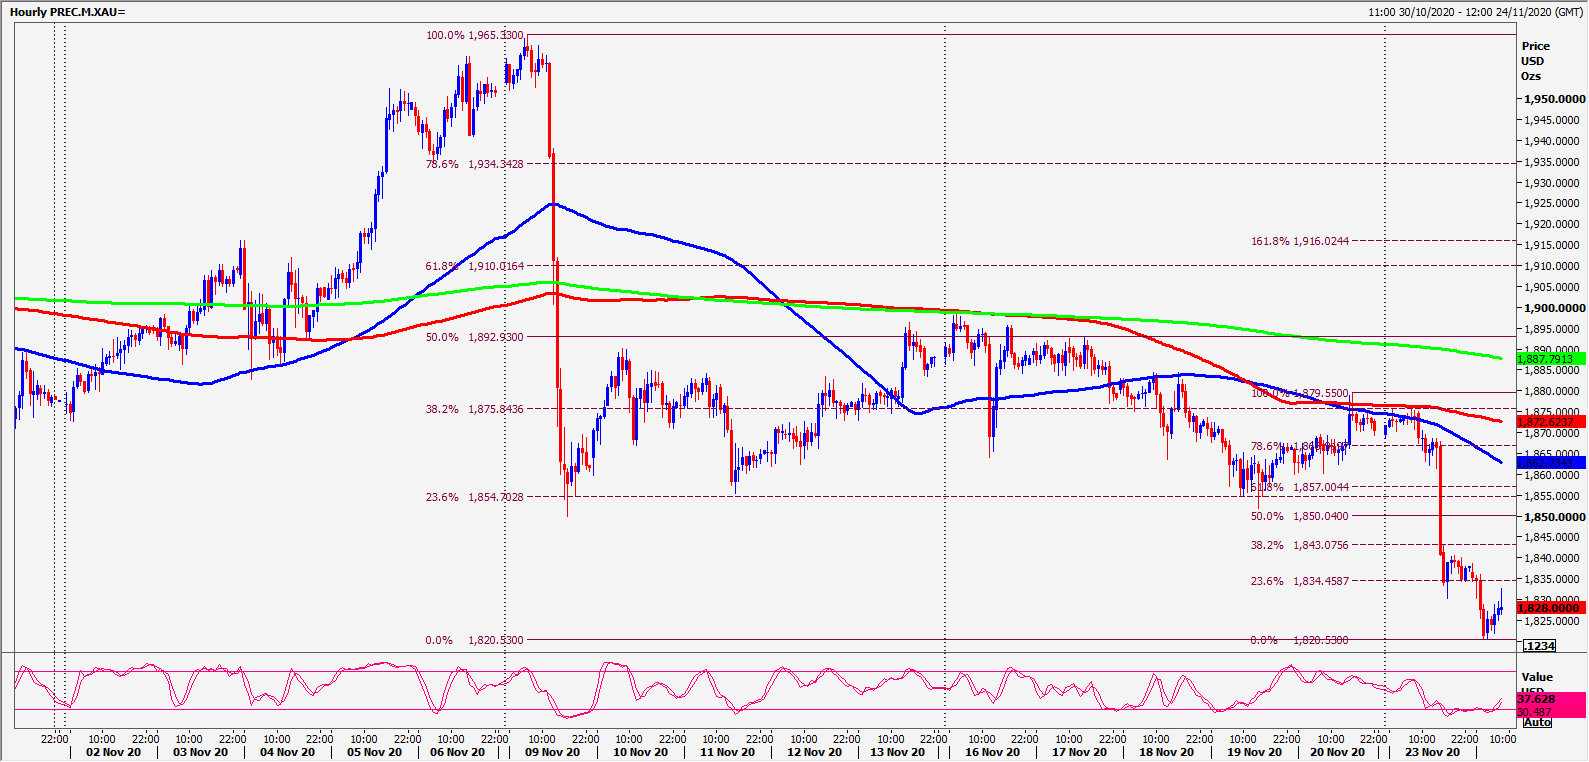
Gold Spot shorts at 1875/78 worked perfectly again. This time we crashed through important support at the November low at 1850/49. Longs stopped below support atthe September low at 1848/47 for a sell signal initially targeting 1835.

Silver Spot shorts at 2535/45 worked perfectly hitting targets of 2390/85, 2360/55 &2325/20. In fact, as I write we bottomed exactly here for a potential 100 point profit. Read more...

Gold

Gold Price Analysis: XAU/USD hangs near multi-month lows, around $1830 area

Gold maintained its offered tone through the early European session, albeit has managed to pare a part of the early losses to four-month lows. The precious metal was last seen trading near the $1830 region, down around 0.50% for the day.

The commodity added to the overnight losses and witnessed some follow-through selling for the second consecutive session on Tuesday. The downfall also marked the fifth day of a negative move in the previous six and was sponsored by the prevalent risk-on environment, which tends to undermine demand for the safe-haven gold. Read more...

XAU/USD

Overview
Today last price1812.88
Today Daily Change-23.24
Today Daily Change %-1.27
Today daily open1836.12
 
Trends
Daily SMA201886.06
Daily SMA501897.46
Daily SMA1001910.27
Daily SMA2001795.22
 
Levels
Previous Daily High1876.14
Previous Daily Low1831.01
Previous Weekly High1899.14
Previous Weekly Low1852.8
Previous Monthly High1933.3
Previous Monthly Low1860
Daily Fibonacci 38.2%1848.25
Daily Fibonacci 61.8%1858.9
Daily Pivot Point S11819.37
Daily Pivot Point S21802.63
Daily Pivot Point S31774.24
Daily Pivot Point R11864.5
Daily Pivot Point R21892.89
Daily Pivot Point R31909.63

Author

More from FXStreet Team
Share:

Editor's Picks

EUR/USD keeps the offered stance just above 1.1700

EUR/USD is coming under heavy selling pressure in what has been a rather grim start to the new trading week, with the pair now trading close to the 1.1700 support area as the US Dollar stages a solid rebound. The prevailing flight to safety mood continues to favour the Greenback, as investors react to the escalating conflict in the Middle East and trim risk exposure across the board.

GBP/USD hits new yearly lows near 1.3300

GBP/USD adds to the recent bearish tone, approaching to the key 1.3300 support to reach fresh YTD troughs against the backdrop of the robust performance of the US Dollar. Indeed, Cable’s decline comes amid the firm demand for the safe-haven space in the wake of the US and Israel attacks to Iran.

Gold trims losses, back below $5,400

Gold now surrenders part of the earlier advance past the $5,400 mark per troy ounce at the beginning of the week. Indeed, the precious metal’s strong uptick remains fuelled by increasing geopolitical tensions in the Middle East amid the intense demand for safer assets.

Bitcoin on brink of breakdown amid US-Iran war

Bitcoin (BTC) remains under pressure near the key support level of $65,700. Trading at $66,400 at the time of writing on Monday, a breakdown below this critical level would suggest a deeper correction ahead.

The Fed is finally talking about AI – Here's why it matters for the US Dollar

AI is moving from earnings calls into the heart of monetary policy discussions, forcing Federal Reserve officials to confront a new question: How to act if AI reshapes inflation, employment and interest rates at the same time?

Grass 20% bullish breakout defies broader market weakness

Grass (GRASS) is edging up above $0.30 at the time of writing on Monday. The token’s notable 20% intraday surge stands out amid heightened volatility in the broader crypto market.