Gold price forecast: XAU/USD turns sideways below $1,720 ahead of Fed policy
- Gold price is displaying a lackluster performance as investors await Fed policy for further guidance.
- Lower Consumer Confidence and weak Walmart’s earnings show indicate a slowdown in retail demand.
- The Fed will hopefully elevate its interest rates by 75 bps.

Gold price (XAU/USD) is displaying back and forth moves in a narrow range of $1,713.92-1,721.97 as investors are awaiting the announcement of the fourth consecutive interest rate decision by the Federal Reserve (Fed). The precious metal has displayed a complete volatility contraction, which indicates that now the monetary policy announcement is the only trigger that will fetch auctions in the asset.
The Fed is expected to elevate its interest rates by 75 basis points (bps). This will step up the cost of capital to 2.25-2.50%.
On Tuesday, the release of the US Consumer Confidence failed to bring a significant impact on gold prices. The economic data has decreased consecutively for a third month to 95.7 after the June figure of 98.4. Apart from that, US giant retail chain operator Walmart reported downbeat earnings.
The underperformance of Consumer Confidence and softer earnings by retail giant indicate that retail demand has been hit dramatically by soaring price pressures. No doubt, the US Retail Sales data remained upbeat after landing at 1%, higher than the expectations of 0.6% but they were highly contaminated by runaway inflation.
Gold technical analysis
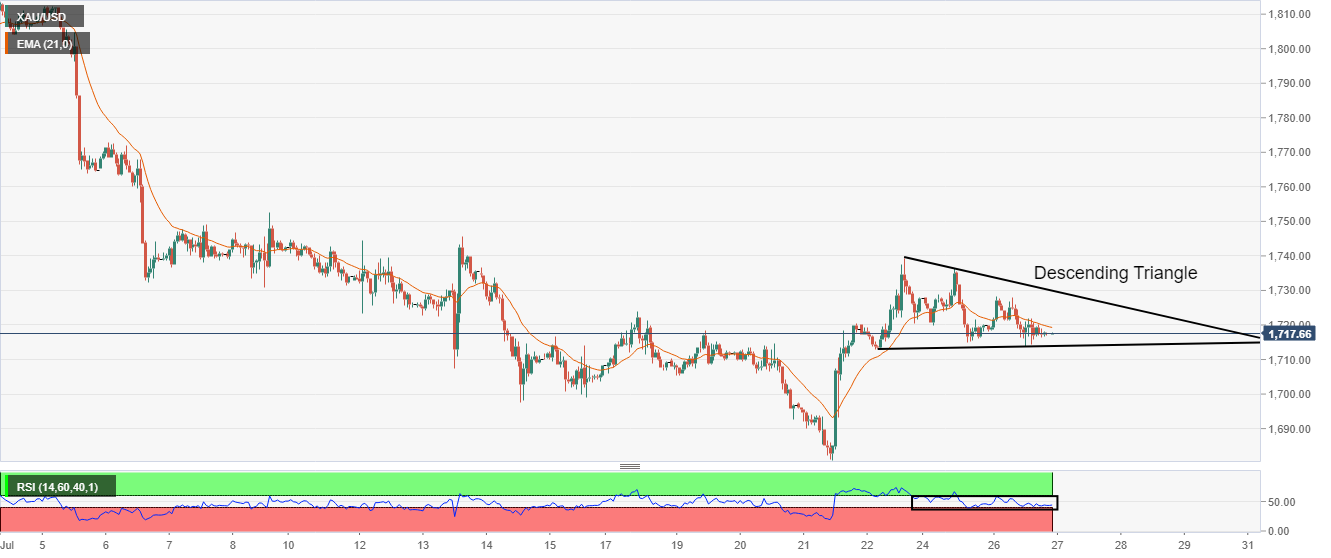
On an hourly scale, the gold price is auctioning in a descending triangle pattern. The downward-sloping trendline of the volatility contraction pattern is placed from July 22 high at $1,739.37. While the horizontal support is placed from July 22 low at $1,712.94. The above-mentioned chart pattern indicates a volatility squeeze, which will be followed by an expansion in volumes and candlesticks’ range.
The gold prices are overlapping with the 50-period Exponential Moving Average (EMA) at $1,719.42, which signals a consolidation ahead.
Also, the Relative Strength Index (RSI) (14) has shifted into a 40.00-60.00 range, which signals that the asset is awaiting potential a trigger for a decisive move.
Gold hourly chart
Author

Sagar Dua
FXStreet
Sagar Dua is associated with the financial markets from his college days. Along with pursuing post-graduation in Commerce in 2014, he started his markets training with chart analysis.


