Gold Price Forecast: XAU/USD tests key moving averages before next move


  • Gold lost its traction after rising above $1,820 on Tuesday.
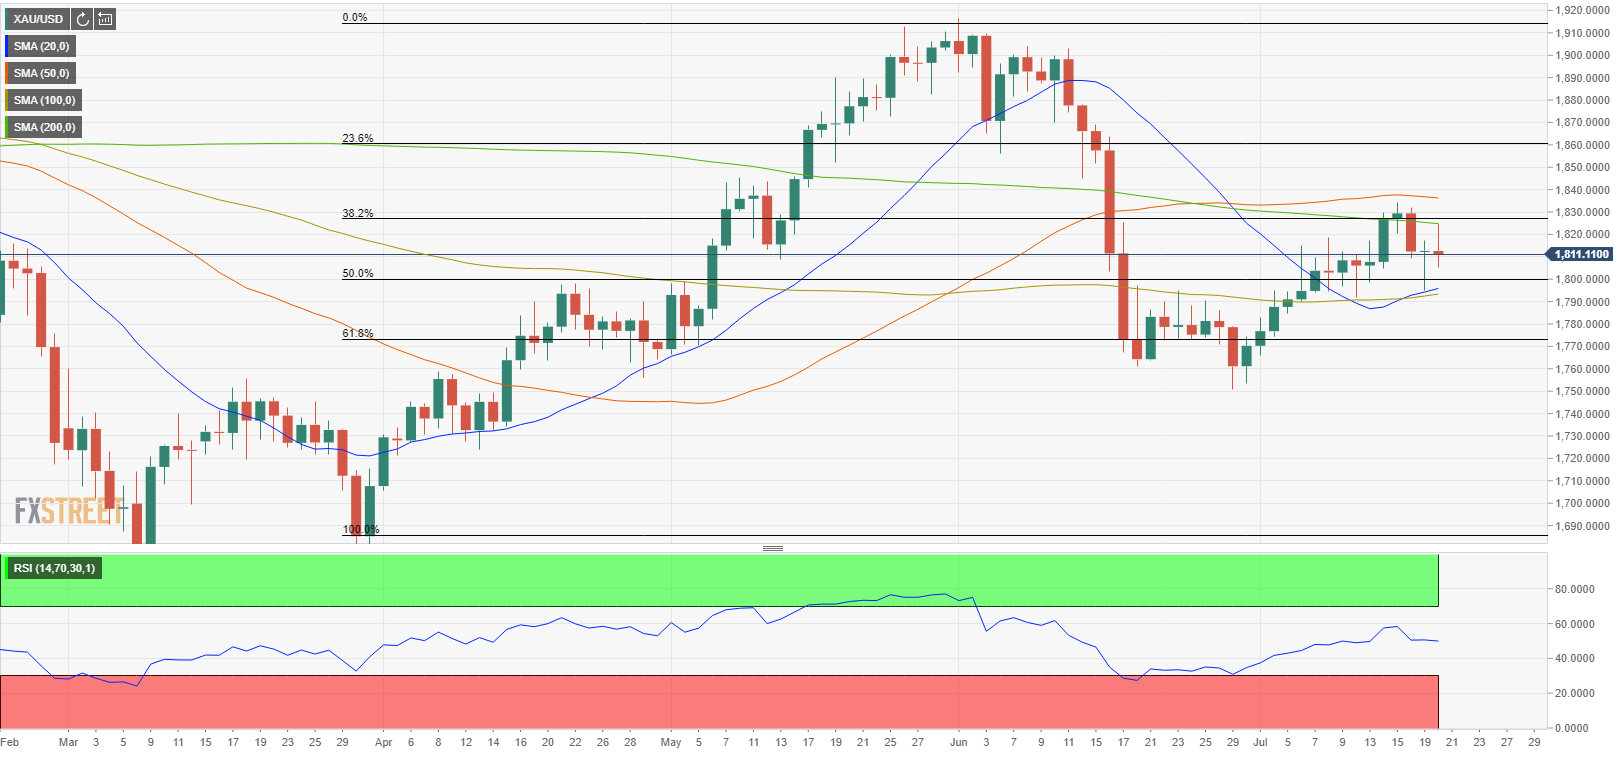
  • XAU/USD fluctuates between the 100-day and 200-day SMAs.
  • Broad-based USD strength continues to limit gold's upside.

After dipping below $1,800 at the start of the week, gold managed to close virtually unchanged at $1,812 on Monday despite the broad-based USD strength. On Tuesday, XAU/USD gained traction and climbed to a daily high of $1,825 but failed to preserve its bullish momentum. As of writing, gold was posting small daily losses at $1,810.

The recent market action suggests that the precious metal is starting to find demand in the risk-averse market environment after losing its safe-haven status during the first half of the year.

Renewed concerns over the quick spread of the coronavirus Delta variant crippling the global economic recovery and inflation staying high for longer than expected triggered a flight to safety on Monday. Major global equity indexes suffered heavy losses and the benchmark 10-year US Treasury bond yield lost nearly 7% with investors seeking refuge. In the meantime, the USD gathered strength, especially against the risk-sensitive commodity currencies, and made it difficult for XAU/USD to push higher.

On Tuesday, the decisive rebound witnessed in Wall Street's main indexes seems to be limiting gold's gains. Moreover, the US Dollar Index, which tracks the USD's performance against a basket of six major currencies, stays in the positive territory and puts additional weight on XAU/USD's shoulders.

The only data from the US showed earlier in the day that Housing Starts increased by 6.3% in June, bettering May's reading of 2.1%. On a negative note, Building Permits declined by 5.1% in the same period.

There won't be any high-tier macroeconomic data releases on Wednesday. With market participants assessing how the shift in the risk sentiment will impact assets' valuations moving forward, gold's next move is likely to come on a failure of a key technical level.

Gold technical outlook

Despite the recent fluctuations, the Relative Strength Index (RSI) indicator on the daily chart is moving sideways around 50, underlining XAU/USD indecisiveness in the near term.

Gold's volatility is likely to pick up in case the price breaks out of the horizontal range that seems to have formed between $1,790 (100-day SMA, 20-day SMA) and $1,825 (200-day SMA). A daily close above the resistance area is likely to open the door for additional gains toward $1,835 (50-day SMA).

On the flip side, $1,770 (Fibonacci 61.8% retracement of April-June uptrend) aligns as the next target below $1,790 with $1,800 (psychological level) possibly acting as interim support ahead of these levels. 

Additional levels to watch for

XAU/USD

Overview
Today last price 1809.63
Today Daily Change -2.99
Today Daily Change % -0.16
Today daily open 1812.62
 
Trends
Daily SMA20 1794.28
Daily SMA50 1836.8
Daily SMA100 1792.51
Daily SMA200 1825.34
 
Levels
Previous Daily High 1817.38
Previous Daily Low 1795.09
Previous Weekly High 1834.17
Previous Weekly Low 1791.75
Previous Monthly High 1916.62
Previous Monthly Low 1750.77
Daily Fibonacci 38.2% 1808.87
Daily Fibonacci 61.8% 1803.6
Daily Pivot Point S1 1799.35
Daily Pivot Point S2 1786.07
Daily Pivot Point S3 1777.06
Daily Pivot Point R1 1821.64
Daily Pivot Point R2 1830.65
Daily Pivot Point R3 1843.93


Share: Feed news

Information on these pages contains forward-looking statements that involve risks and uncertainties. Markets and instruments profiled on this page are for informational purposes only and should not in any way come across as a recommendation to buy or sell in these assets. You should do your own thorough research before making any investment decisions. FXStreet does not in any way guarantee that this information is free from mistakes, errors, or material misstatements. It also does not guarantee that this information is of a timely nature. Investing in Open Markets involves a great deal of risk, including the loss of all or a portion of your investment, as well as emotional distress. All risks, losses and costs associated with investing, including total loss of principal, are your responsibility. The views and opinions expressed in this article are those of the authors and do not necessarily reflect the official policy or position of FXStreet nor its advertisers. The author will not be held responsible for information that is found at the end of links posted on this page.

If not otherwise explicitly mentioned in the body of the article, at the time of writing, the author has no position in any stock mentioned in this article and no business relationship with any company mentioned. The author has not received compensation for writing this article, other than from FXStreet.

FXStreet and the author do not provide personalized recommendations. The author makes no representations as to the accuracy, completeness, or suitability of this information. FXStreet and the author will not be liable for any errors, omissions or any losses, injuries or damages arising from this information and its display or use. Errors and omissions excepted.

The author and FXStreet are not registered investment advisors and nothing in this article is intended to be investment advice.

Recommended content


Recommended content

Editors’ Picks

EUR/USD extends gains above 1.0700, focus on key US data

EUR/USD extends gains above 1.0700, focus on key US data

EUR/USD meets fresh demand and rises toward  1.0750 in the European session on Thursday. Renewed US Dollar weakness offsets the risk-off market environment, supporting the pair ahead of the key US GDP and PCE inflation data. 

EUR/USD News

USD/JPY keeps pushing higher, eyes 156.00 ahead of US GDP data

USD/JPY keeps pushing higher, eyes 156.00 ahead of US GDP data

USD/JPY keeps breaking into its highest chart territory since June of 1990 early Thursday, recapturing 155.50 for the first time in 34 years as the Japanese Yen remains vulnerable, despite looming intervention risks. The focus shifts to Thursday's US GDP report and the BoJ decision on Friday. 

USD/JPY News

Gold closes below key $2,318 support, US GDP holds the key

Gold closes below key $2,318 support, US GDP holds the key

Gold price is breathing a sigh of relief early Thursday after testing offers near $2,315 once again. Broad risk-aversion seems to be helping Gold find a floor, as traders refrain from placing any fresh directional bets on the bright metal ahead of the preliminary reading of the US first-quarter GDP due later on Thursday.

Gold News

Injective price weakness persists despite over 5.9 million INJ tokens burned

Injective price weakness persists despite over 5.9 million INJ tokens burned

Injective price is trading with a bearish bias, stuck in the lower section of the market range. The bearish outlook abounds despite the network's deflationary efforts to pump the price. 

Read more

US Q1 GDP Preview: Economic growth set to remain firm in, albeit easing from Q4

US Q1 GDP Preview: Economic growth set to remain firm in, albeit easing from Q4

The United States Gross Domestic Product (GDP) is seen expanding at an annualized rate of 2.5% in Q1. The current resilience of the US economy bolsters the case for a soft landing. 

Read more

Forex MAJORS

Cryptocurrencies

Signatures