|

Gold Price Forecast: XAU/USD struggles to kiss $1,810 as risk-off mood remains solid

  • Gold price is struggling to surpass the crucial resistance of $1,810.00 amid a risk-off mood.
  • Fresh stipulations of arrivals from China from various nations are expected to strengthen the US Dollar Index.
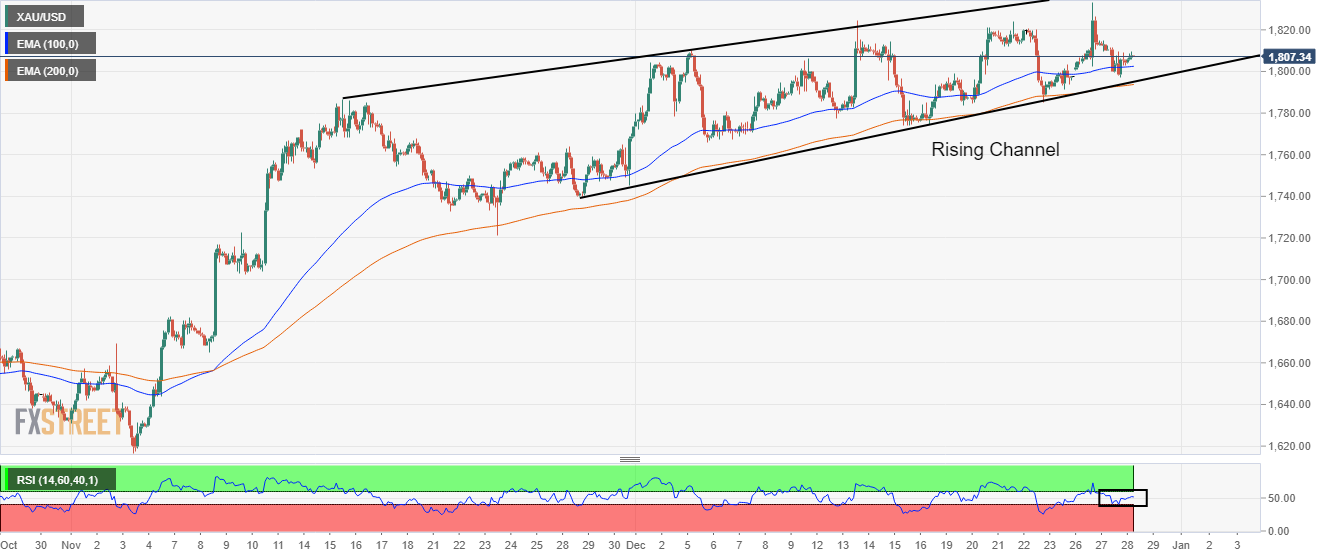
  • A 40.00-60.00 range oscillation by the RSI (14) is hinting a consolidation ahead.

Gold price (XAU/USD) is facing barricades while attempting to surpass the immediate resistance of $1,810.00 in the Asian session. The precious metal is displaying an intraday inventory adjustment process, which is expected to display volatility expansion. The US Dollar Index (DXY) has displayed a recovery move after a steep correction to near 104.30.

It seems that fresh stipulations of arrivals from China from various nations, citing rising Covid-19 infections responsible for safety measures have improved the safe-haven’s appeal. The US Dollar Index has revived to near 104.40 and is expected to display more upside ahead. S&P500 futures are displaying a lackluster performance as trading activity is getting squeezed amid the festive season.

Meanwhile, 10-year US Treasury yields have corrected marginally to near 3.76% after a three-day rally. China’s Covid-inspired caution in the global markets has trimmed the demand for US government bonds. Going forward, investors will keep an eye on the release of the weekly Initial Jobless Claims data. For the past week, the United States economy reported an increment in fresh claims by 216K.

Gold technical analysis

On a two-hour scale, the Gold price is trading in a Rising Channel chart pattern that signals volatility contraction. The upper portion of the aforementioned chart pattern is placed from November 15 high at $1,786.55 while the lower portion is plotted from November 28 low at $1,739.82.

The precious metal has picked strength after dropping to near the 100-period Exponential Moving Average (EMA) at $1,802.20. Also, the 200-EMA at $1,793.35 is aiming higher, which indicates that the upside bias is still solid.

Meanwhile, the Relative Strength Index (RSI) (14) is oscillating in a 40.00-60.00 range, which signals that Gold price is awaiting a fresh trigger for a decisive move.

Gold two-hour chart

XAU/USD

Overview
Today last price1807.44
Today Daily Change3.06
Today Daily Change %0.17
Today daily open1804.38
 
Trends
Daily SMA201795.02
Daily SMA501742.79
Daily SMA1001722.55
Daily SMA2001781.68
 
Levels
Previous Daily High1814.65
Previous Daily Low1797.11
Previous Weekly High1823.84
Previous Weekly Low1783.84
Previous Monthly High1786.55
Previous Monthly Low1616.69
Daily Fibonacci 38.2%1803.81
Daily Fibonacci 61.8%1807.95
Daily Pivot Point S11796.11
Daily Pivot Point S21787.84
Daily Pivot Point S31778.57
Daily Pivot Point R11813.65
Daily Pivot Point R21822.92
Daily Pivot Point R31831.19

Author

Sagar Dua

Sagar Dua

FXStreet

Sagar Dua is associated with the financial markets from his college days. Along with pursuing post-graduation in Commerce in 2014, he started his markets training with chart analysis.

More from Sagar Dua
Share:

Editor's Picks

GBP/USD bounces off lows, back above 1.3200

After bottoming out near 1.3160, GBP/USD manages to regain a bit of shine and reclaim the 1.3200 mark and beyond at the end of the week. Stronger-than-expected UK Retail Sales data seem to be helping the British Pound limit its losses, while the chaotic UK political environment keeps the bulls at bay for now.

EUR/USD looks consolidative around 1.1460

EUR/USD stages a modest rebound after slipping to a three-month low below 1.1420 at the end of the week. That said, the pair now looks to consolidate humble gains just above 1.1460 despite growing uncertainty surrounding the next round of US-Iran negotiations, which keeps the US Dollar’s downside contained.

Gold slips back to six-day lows, targets $4,100

Gold retreats for the third consecutive day on Friday, eroding gains seen in the first half of the week and approaching the key $4,100 mark per troy ounce. Indeed, the precious metal continues to face headwinds from the Fed's hawkish stance and renewed uncertainty surrounding the next round of US-Iran negotiations.

Breaking: Iran closes the Strait of Hormuz amid ceasefire deal violation
Iran says it is closing the Strait of Hormuz after accusing the United States (US) and Israel of violating the ceasefire. According to Iran, the decision came over the continued Israeli strikes in Lebanon. The Iranian Revolutionary Guard Corps Navy issued a warning to all vessels: "Do not approach the Strait of Hormuz; otherwise, your security will be jeopardized."
The Iran war didn't break the US economy, but what happens next?

Nearly four months after the start of the Iran war, the US economy remains remarkably resilient. While the conflict initially triggered a severe disruption to global energy markets and a sharp rise in Oil prices, recent diplomatic progress between Washington and Tehran has eased concerns about a prolonged supply shock.

Regime change: Inside Kevin Warsh's first move to make the Fed unreadable on purpose

The rate did not move. That was the least interesting thing about Kevin Warsh's first meeting in charge of the Fed. The FOMC held its benchmark at 3.50%-3.75% for the fourth straight meeting, exactly as priced, and then the new chair used his first press conference to dismantle the machinery the market has leaned on for a decade.