Gold Price Forecast: XAU/USD slumps to near $4,050 as traders pare dovish Fed bets
- Gold price faces a sharp selling pressure as Fed dovish bets ease significantly.
- Many FOMC members argued against reducing interest rates in December.
- Investors await the US NFP data for fresh cues on the Fed’s interest rate outlook.

Gold price (XAU/USD) trades 0.5% lower to near $4,052.00 during the European trading session on Thursday. The yellow metal faces selling pressure as traders have trimmed bets supporting an interest rate cut by the Federal Reserve (Fed) in the December policy meeting.
The CME FedWatch tool shows that the probability of the Fed cutting interest rates by 25 basis points (bps) to 3.50%-3.75% in the December meeting has diminished to 32.8% from 50.1% seen on Tuesday.
The scenario of the Fed holding interest rates steady bodes poorly for non-yielding assets, such as Gold.
Fed dovish bets eased significantly on Wednesday after the release of the Federal Open Market Committee (FOMC) minutes of the October meeting, which showed signs that policymakers are not comfortable with the option of reducing interest rates in the December meeting.
“Most participants noted further rate cuts could add to the risk of higher inflation becoming entrenched or could be misinterpreted as a lack of commitment to the 2% inflation objective,” according to FOMC minutes.
Meanwhile, investors brace for significant price action in the Gold price, with the United States (US) Nonfarm Payrolls (NFP) data for October scheduled to be published at 13:30 GMT. The official employment data will influence market expectations for the Fed’s monetary policy outlook.
Gold technical analysis
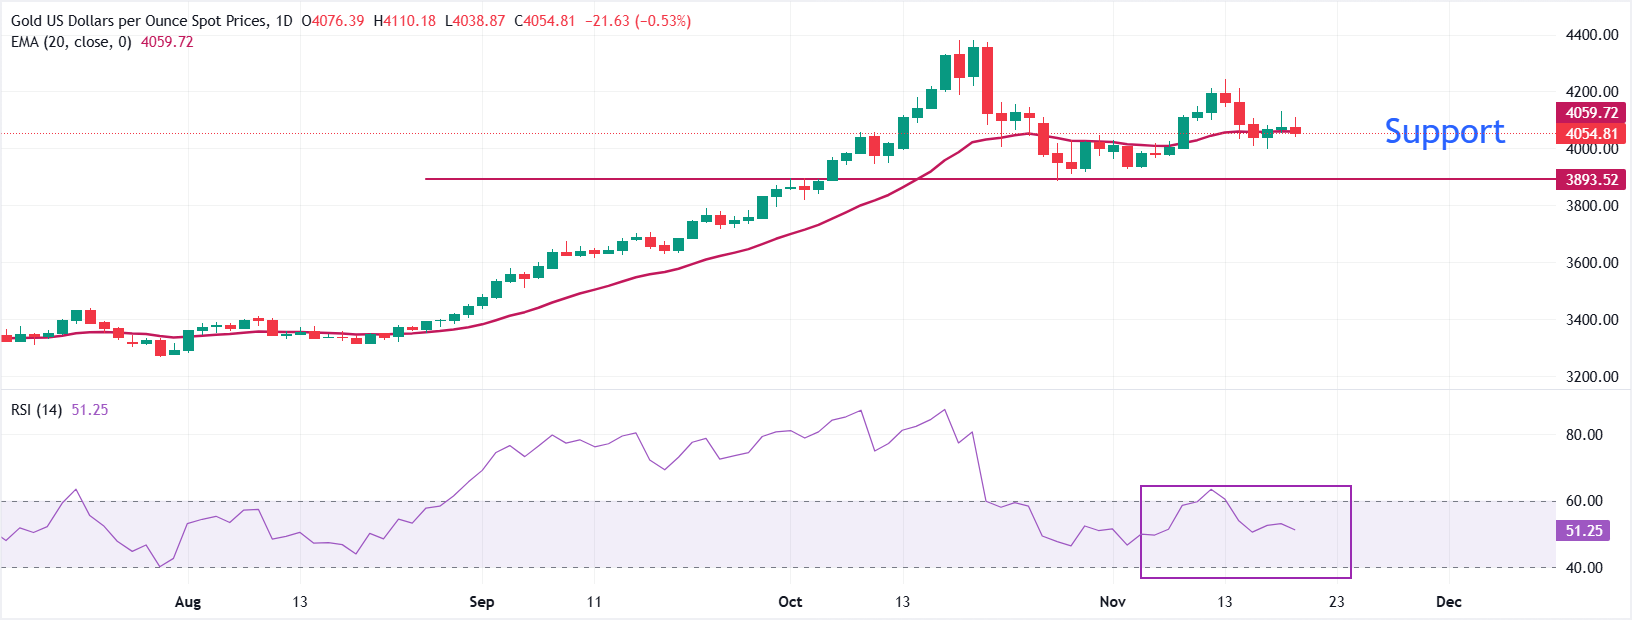
Gold price wobbles broadly near the 20-day Exponential Moving Average (EMA) around $4,053, indicating a sideways trend.
The 14-day Relative Strength Index (RSI) trades inside the 40.00-60.00 range, suggesting indecisiveness among investors
Looking down, the October 28 high near $3,888.62 will act as key support for the Gold price. On the upside, the all-time high near $4,380 will be the major resistance.
Gold daily chart
Gold FAQs
Gold has played a key role in human’s history as it has been widely used as a store of value and medium of exchange. Currently, apart from its shine and usage for jewelry, the precious metal is widely seen as a safe-haven asset, meaning that it is considered a good investment during turbulent times. Gold is also widely seen as a hedge against inflation and against depreciating currencies as it doesn’t rely on any specific issuer or government.
Central banks are the biggest Gold holders. In their aim to support their currencies in turbulent times, central banks tend to diversify their reserves and buy Gold to improve the perceived strength of the economy and the currency. High Gold reserves can be a source of trust for a country’s solvency. Central banks added 1,136 tonnes of Gold worth around $70 billion to their reserves in 2022, according to data from the World Gold Council. This is the highest yearly purchase since records began. Central banks from emerging economies such as China, India and Turkey are quickly increasing their Gold reserves.
Gold has an inverse correlation with the US Dollar and US Treasuries, which are both major reserve and safe-haven assets. When the Dollar depreciates, Gold tends to rise, enabling investors and central banks to diversify their assets in turbulent times. Gold is also inversely correlated with risk assets. A rally in the stock market tends to weaken Gold price, while sell-offs in riskier markets tend to favor the precious metal.
The price can move due to a wide range of factors. Geopolitical instability or fears of a deep recession can quickly make Gold price escalate due to its safe-haven status. As a yield-less asset, Gold tends to rise with lower interest rates, while higher cost of money usually weighs down on the yellow metal. Still, most moves depend on how the US Dollar (USD) behaves as the asset is priced in dollars (XAU/USD). A strong Dollar tends to keep the price of Gold controlled, whereas a weaker Dollar is likely to push Gold prices up.
Author

Sagar Dua
FXStreet
Sagar Dua is associated with the financial markets from his college days. Along with pursuing post-graduation in Commerce in 2014, he started his markets training with chart analysis.


