|

Gold Price Forecast: XAU/USD slips below $1,790 as DXY extends recovery, Michigan CSI eyed

  • Gold price has slipped to near $1,785.00 as the DXY has advanced above 105.00.
  • The precious metal has shifted into a healthy correction phase.
  • A little higher consensus for Michigan CSI has supported the DXY bulls.

Gold price (XAU/USD) has dropped to near $1,785.00 after surrendering the critical support of $1,788.00 in the Asian session. The precious metal has entered into a healthy correction phase after printing a fresh monthly high at $1,807.96 on Wednesday.

Investors are trimming their gold positions after realizing that the lower US Consumer Price Index (CPI) for a single month can trim the hawkish guidance by the Federal Reserve (Fed) but cannot shrug off the odds of a rate hike in September. To be noted, the plain-vanilla US CPI landed at 8.5%, lower than the forecasts and the prior release of 8.7% and 9.1% respectively.

Meanwhile, the US dollar index (DXY) has extended its recovery after a confident pullback move and has reached to near 105.40. Now, the market participants are shifting their focus toward the US Michigan Consumer Sentiment Index (CSI), which is due on Friday. The sentiment data is expected to improve to 52.2 from the prior release of 51.5. A consecutive improvement is expected in the confidence of consumers after the data slipped to 50 for the first time in the past 20 years.

Gold technical analysis

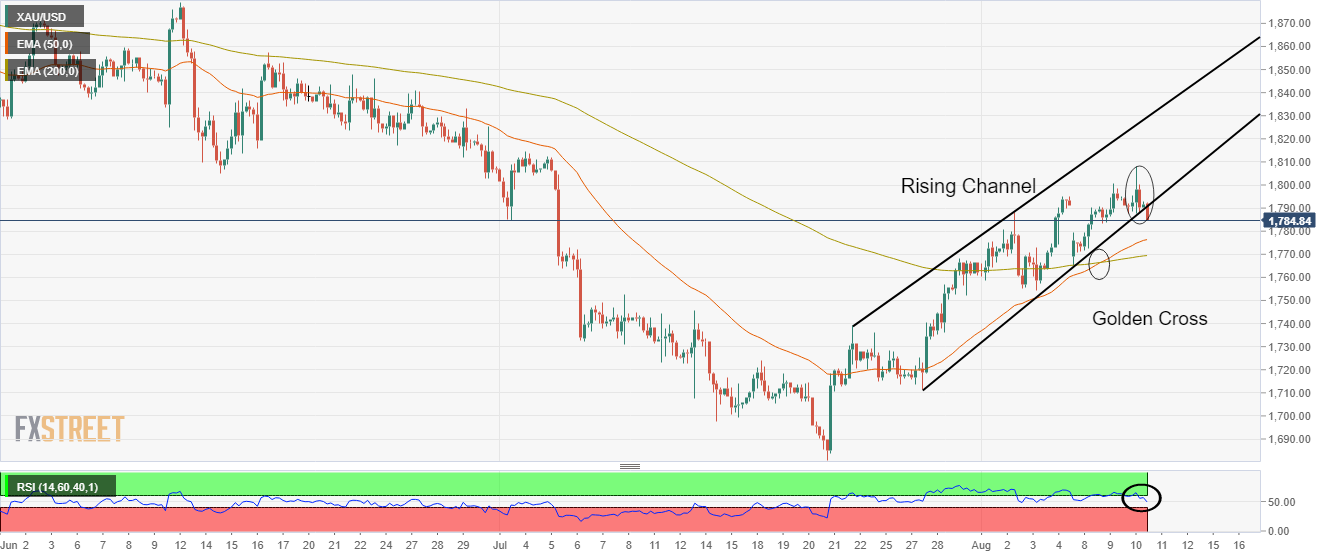
Gold price has surrendered the cushion of the lower portion of the Rising Channel at $1,788.00, formed on the four-hour scale. The upper portion of the above-mentioned chart pattern is placed from July 22 high at $1,739.37 while the lower portion is plotted from July 27 low at $1,711.55.

A golden cross, represented by the 50-and 200-period Exponential Moving Averages (EMAs) at $1,768.90 adds to the upside filters.

While the Relative Strength Index (RSI) has shifted into the 40.00-60.00 range pertaining to a mild correction but is likely o find support at 40.00

Gold four-hour chart

XAU/USD

Overview
Today last price1785.45
Today Daily Change-6.88
Today Daily Change %-0.38
Today daily open1792.33
 
Trends
Daily SMA201745.8
Daily SMA501785.7
Daily SMA1001840.8
Daily SMA2001841.95
 
Levels
Previous Daily High1807.93
Previous Daily Low1787.65
Previous Weekly High1794.97
Previous Weekly Low1754.35
Previous Monthly High1814.37
Previous Monthly Low1680.91
Daily Fibonacci 38.2%1795.4
Daily Fibonacci 61.8%1800.18
Daily Pivot Point S11784.01
Daily Pivot Point S21775.69
Daily Pivot Point S31763.73
Daily Pivot Point R11804.29
Daily Pivot Point R21816.25
Daily Pivot Point R31824.57

Author

Sagar Dua

Sagar Dua

FXStreet

Sagar Dua is associated with the financial markets from his college days. Along with pursuing post-graduation in Commerce in 2014, he started his markets training with chart analysis.

More from Sagar Dua
Share:

Markets move fast. We move first.

Orange Juice Newsletter brings you expert driven insights - not headlines. Every day on your inbox.

By subscribing you agree to our Terms and conditions.

Editor's Picks

EUR/USD consolidates below 1.1700 amid cautious markets

EUR/USD is holding steady below 1.1700 in the European trading hours on Thursday. The pair pauses its losing streak as the US Dollar consolidates the recent recovery amid a cautious market mood and ahead of the mid-tier US employment data. 

GBP/USD turns lower to near 1.3450 amid softer risk tone

GBP/USD loses ground to trade near 1.3450 in the early European session on Thursday. Markets turn cautious amid simmering geopolitical tensions and ahead of the US labor market data due later in the day. 

Gold selling pressure persists as traders lock in profits ahead of US NFP report

Gold remains under some selling pressure for the second straight day and slides back closer to the overnight swing low during the Asian session on Thursday. The downtick lacks any fundamental catalyst and is likely to remain limited amid a supportive fundamental backdrop. 

Pi Network flashes bearish potential as selling pressure mounts

Pi Network trades above $0.2000 at press time on Thursday, following a nearly 2% decline the previous day. Centralized Exchanges have received 1.90 million PI tokens over the last 24 hours, suggesting risk-off sentiment among holders. The technical outlook for the PI token remains bearish, with a risk of a cross below the 20-day Exponential Moving Average. 

2026 economic outlook: Clear skies but don’t unfasten your seatbelts yet

Most years fade into the background as soon as a new one starts. Not 2025: a year of epochal shifts, in which the macroeconomy was the dog that did not bark. What to expect in 2026? The shocks of 2025 will not be undone, but neither will they be repeated.

Pi Network Price Forecast: PI flashes bearish potential as selling pressure mounts

Pi Network trades above $0.2000 at press time on Thursday, following a nearly 2% decline the previous day. Centralized Exchanges have received 1.90 million PI tokens over the last 24 hours, suggesting risk-off sentiment among holders.