Gold Price Forecast: XAU/USD sees a downside below $1,800 as Fed looks set to raise rates above 5%
- Gold price is expected to continue its four-day losing streak amid hawkish Fed bets.
- Investors should be prepared for a surprise rise in US Durable Goods Orders as the households' demand has accelerated lately.
- Gold price is trading in a Falling Channel chart pattern in which every pullback is considered a selling opportunity.

Gold price (XAU/USD) is demonstrating a topsy-turvy auction around $1,810.00 in the Asian session. The precious metal is expected to continue its four-day losing streak after surrendering the immediate support of $1,809.00 as Federal Reserve (Fed) policymakers see interest rates above 5% after January’s hot inflation data..
Cleveland Fed Bank President Loretta Mester cited “Will need to go above 5% funds rate, stay there for a while.” He further added, “Data shows inflation not yet on trend to get back sustainably to 2% target.”
An escalation in the United States Personal Consumption Expenditure (PCE) price index by 0.6% in January has cleared that it would be early announcing victory for the battle against inflation. A strong labor cost index has propelled consumer spending, which could result in a recovery in the Producer Price Index (PPI) ahead.
The US Dollar Index (DXY) is struggling to continue the upside move toward the 105.00 resistance. S&P500 futures are showing nominal gains after a bearish Friday, portraying a sheer drop in the risk appetite of the market participants. The return delivered on 10-year US Treasury bonds has dropped marginally below 3.94%.
Going forward, the Gold price will display action post the release of the US Durable Goods Orders (Jan) data. The street is expecting a contraction of 4% lower than the expansion of 5.6% released earlier. Investors should be prepared for a surprise rise as the households' demand has accelerated lately.
Gold technical analysis
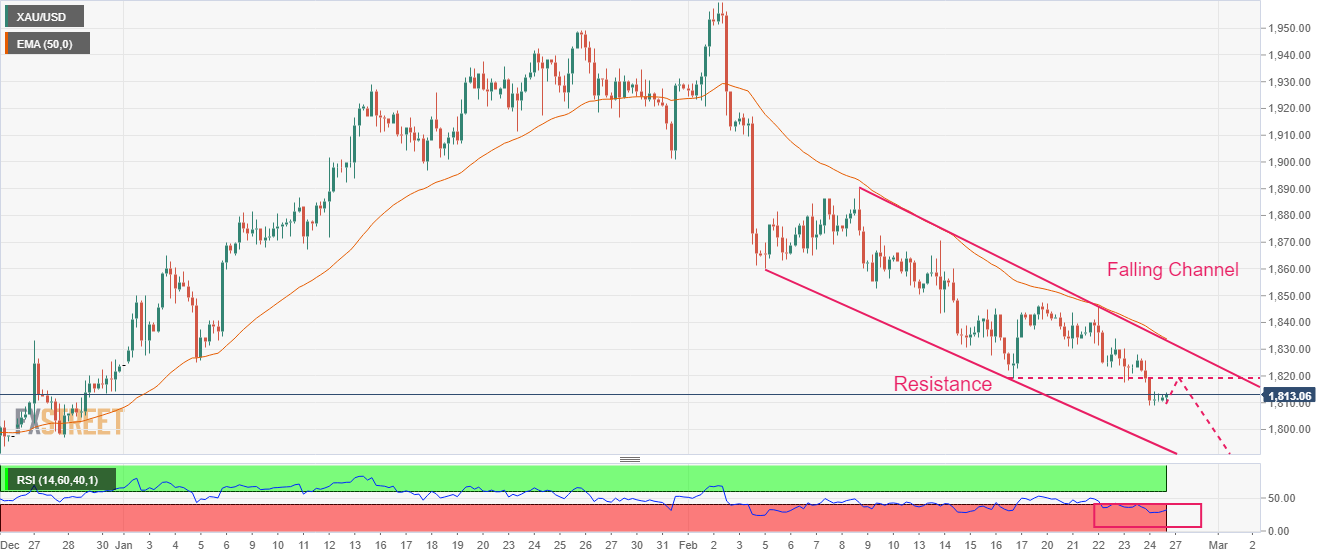
Gold price is trading in a Falling Channel chart pattern in which every pullback is considered as a selling opportunity before a reversal move. The yellow metal is expected to find resistance around $1,820.00 after a minor pullback move.
The 50-period Exponential Moving Average (EMA) at $1,833.80 is acting as a major barricade for the Gold bulls.
The Relative Strength Index (RSI) (14) is oscillating in the bearish range of 20.00-40.00, which advocates further downside.
Gold hourly chart
Author

Sagar Dua
FXStreet
Sagar Dua is associated with the financial markets from his college days. Along with pursuing post-graduation in Commerce in 2014, he started his markets training with chart analysis.