Gold Price Forecast: XAU/USD reverses intraday losses from $1630, US Durable Goods Orders buzz


Share:
  • Gold prices have rebounded firmly from $1,630.00, supporting a further pullback move.
  • The risk-off market mood pushed the DXY above 114.50.
  • Weaker forecasts for US Durable Goods Orders data will restrict the DXY’s upside.

Gold price (XAU/USD) has recovered the major portion of the losses recorded in the Tokyo session. The precious metal declined sharply to near $1,630.00 but recovered firmly and is indicating a formation of buying tail, which indicates a strong responsive buying structure. The yellow metal is attempting to shift into the prior balanced area placed in a narrow range of $1,640.00-1,649.06.

Meanwhile, the US dollar index (DXY) moved sharply to 114.52 as the risk profile turned sour on China’s leader Xi Jinping's house arrest and the Russian Federation’s warning of a nuclear attack in retaliation to western sanctions. The G-7 cartel is aiming to cripple the Russian economy by enforcing a spree of western sanctions so that that trading structure could get demolished.

The firmer move by the DXY towards 114.52 has also picked offers too ahead of US Durable Goods Orders data. As per the consensus, the economic data will decline by 1.1% against the prior decline of 0.1%. The impact will mainly come from weaker demand for gasoline and a 20 basis point (bps) decline in the headline Consumer Price Index (CPI) in the August reading.

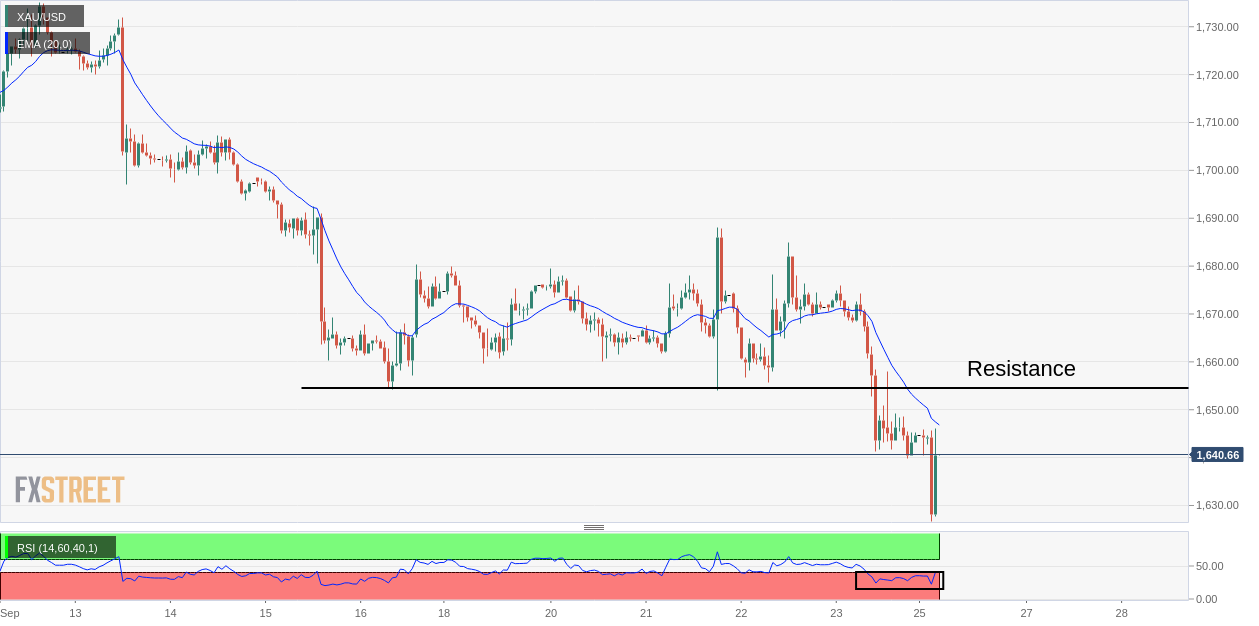
Gold technical analysis

On an hourly scale, the gold prices are attempting to hit the 20-period Exponential Moving Average (EMA) at $1,650.54. If the precious metal manages to overstep the 20-EMA, it will find major barricades around the horizontal resistance placed from September 16 low at $1,654.41.

The Relative Strength Index (RSI) (14) is oscillating in a 20.00-40.00 range, which indicates that the downside momentum is still intact.

Gold hourly chart

XAU/USD

Overview
Today last price 1640.41
Today Daily Change -4.25
Today Daily Change % -0.26
Today daily open 1644.66
 
Trends
Daily SMA20 1696.71
Daily SMA50 1731.6
Daily SMA100 1775.07
Daily SMA200 1828.38
 
Levels
Previous Daily High 1675.92
Previous Daily Low 1639.85
Previous Weekly High 1688.11
Previous Weekly Low 1639.85
Previous Monthly High 1807.93
Previous Monthly Low 1709.68
Daily Fibonacci 38.2% 1653.63
Daily Fibonacci 61.8% 1662.14
Daily Pivot Point S1 1631.03
Daily Pivot Point S2 1617.41
Daily Pivot Point S3 1594.96
Daily Pivot Point R1 1667.1
Daily Pivot Point R2 1689.55
Daily Pivot Point R3 1703.17


Share: Feed news

Information on these pages contains forward-looking statements that involve risks and uncertainties. Markets and instruments profiled on this page are for informational purposes only and should not in any way come across as a recommendation to buy or sell in these assets. You should do your own thorough research before making any investment decisions. FXStreet does not in any way guarantee that this information is free from mistakes, errors, or material misstatements. It also does not guarantee that this information is of a timely nature. Investing in Open Markets involves a great deal of risk, including the loss of all or a portion of your investment, as well as emotional distress. All risks, losses and costs associated with investing, including total loss of principal, are your responsibility. The views and opinions expressed in this article are those of the authors and do not necessarily reflect the official policy or position of FXStreet nor its advertisers. The author will not be held responsible for information that is found at the end of links posted on this page.

If not otherwise explicitly mentioned in the body of the article, at the time of writing, the author has no position in any stock mentioned in this article and no business relationship with any company mentioned. The author has not received compensation for writing this article, other than from FXStreet.

FXStreet and the author do not provide personalized recommendations. The author makes no representations as to the accuracy, completeness, or suitability of this information. FXStreet and the author will not be liable for any errors, omissions or any losses, injuries or damages arising from this information and its display or use. Errors and omissions excepted.

The author and FXStreet are not registered investment advisors and nothing in this article is intended to be investment advice.

Follow us on Telegram

Stay updated of all the news

Join Telegram

Recommended content


Follow us on Telegram

Stay updated of all the news

Join Telegram

Recommended content

Editors’ Picks

EUR/USD drops to fresh three-week lows despite US data

EUR/USD drops to fresh three-week lows despite US data

EUR/USD fell to 1.0770 during the American session, the lowest level in three weeks. The pair faces downward pressure, largely driven by a strong US Dollar. The Greenback remained resilient despite weaker-than-expected US data. On Thursday, more jobs data is due with Jobless Claims, ahead of Friday's NFP.

EUR/USD News

GBP/USD heads for fourth consecutive daily loss

GBP/USD heads for fourth consecutive daily loss

GBP/USD broke below 1.2580 and fell to 1.2566, reaching the lowest level since November 24. The US Dollar stays relatively resilient despite softer US jobs data and lower Treasury yields.

GBP/USD News

Gold faces mixed risks, fails to capitalize on lower yields Premium

Gold faces mixed risks, fails to capitalize on lower yields

Gold recovered toward $2,030 after testing $2,020 earlier in the day. The benchmark 10-year US Treasury bond yield declined to its lowest level in three months below 4.15% after US employment data and helped XAU/USD gain traction.

Gold News

Bitcoin-based meme coin ORDI price action wobbles after 1,100% rally

Bitcoin-based meme coin ORDI price action wobbles after 1,100% rally

The Bitcoin-based BRC-20 meme coin, which had people confused as being an actual valuable token, is now slowly creeping up to that status. ORDI price rise over the past couple of days has been astonishing, and with BTC driving the price and crossing $44,000, ORDI is also gaining rapidly. But not for long.

Read more

The Dollar is struggling to trend

The Dollar is struggling to trend

For the last three trading sessions, the dollar index has been crossing up and down the 200-day moving average every day. All in all, the flirting with this level has been going on for more than three weeks, during which neither bulls nor bears were able to form a stable trend.

Read more

Forex MAJORS

Cryptocurrencies

Signatures