Gold Price Forecast: XAU/USD refreshes three-week high, aims to revisit $3,400
- Gold price jumps to near $3,370 as Trump’s new tariff threats have prompted global trade tensions.
- US President Trump announces 30% tariffs on imports from the EU and Mexico.
- Investors shift their focus to the US CPI data for June.

Gold price (XAU/USD) posts a fresh three-week high around $3,370 during the European trading session on Monday. The precious metal extends its winning streak for the fourth consecutive trading day on Monday, as global trade tensions have escalated following the imposition of 30% tariffs by the United States (US) on imports from its major trading partners, the European Union (EU) and Mexico, over the weekend.
Theoretically, heightened global economic tensions increase demand for safe-haven assets, such as Gold.
Over the weekend, US President Trump announced tariffs on the EU and Mexico for not striking a deal during the 90-day reciprocal tariff pause period.
Meanwhile, EU President Ursula von der Leyen has stated that her team is still in talks with Washington and has postponed plans of countermeasures till the August 1 deadline. However, she has warned that the trading bloc could announce proportionate countermeasures, if required, to safeguard its interests.
Last week, the US also imposed tariffs on 20 nations out of which notable names were Japan, Canada, and South Korea that are its leading trading partners.
Going forward, investors will focus on the US Consumer Price Index (CPI) data for June, which will be published on Tuesday. Investors will pay close attention to the US inflation data as it will influence market expectations for the Federal Reserve’s (Fed) monetary policy outlook.
The CPI report is expected to show that price pressure grew at a faster pace. Gold price performs strongly in a high-inflation environment.
Signs of high inflation often force Fed officials to argue in favor of keeping interest rates higher for a longer period. Higher interest rates by the Fed bode poorly for non-yielding assets, such as Gold.
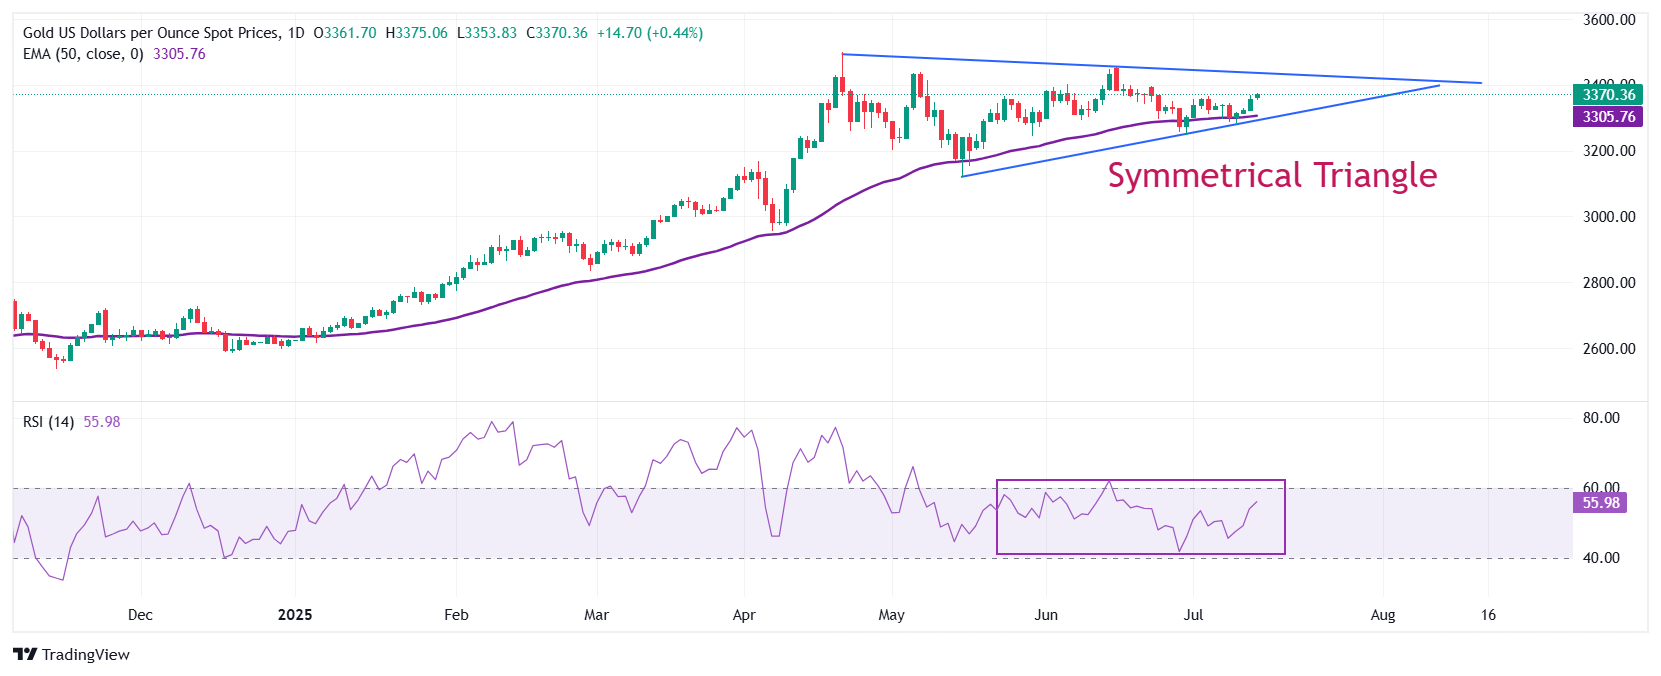
Gold technical analysis
Gold price trades in a Symmetrical Triangle formation on a daily timeframe, which indicates a volatility contraction. The upward-sloping trendline of the above-mentioned chart pattern is placed from the May 15 low of $3,120.83, while its downward-sloping border is plotted from the April 22 high around $3,500
The 50-day Exponential Moving Average (EMA) around $3,305.77 acts as a key support area for the Gold price.
The 14-day Relative Strength Index (RSI) oscillates inside the 40.00-60.00 range, indicating a sideways trend.
Looking up, the Gold price will enter uncharted territory if it breaks above the psychological level of $3,500 decisively. Potential resistances would be $3,550 and $3,600.
Alternatively, the Gold price would fall towards the round-level support of $3,200 and the May 15 low at $3,121, if it breaks below the May 29 low of $3,245
Gold daily chart
Gold FAQs
Gold has played a key role in human’s history as it has been widely used as a store of value and medium of exchange. Currently, apart from its shine and usage for jewelry, the precious metal is widely seen as a safe-haven asset, meaning that it is considered a good investment during turbulent times. Gold is also widely seen as a hedge against inflation and against depreciating currencies as it doesn’t rely on any specific issuer or government.
Central banks are the biggest Gold holders. In their aim to support their currencies in turbulent times, central banks tend to diversify their reserves and buy Gold to improve the perceived strength of the economy and the currency. High Gold reserves can be a source of trust for a country’s solvency. Central banks added 1,136 tonnes of Gold worth around $70 billion to their reserves in 2022, according to data from the World Gold Council. This is the highest yearly purchase since records began. Central banks from emerging economies such as China, India and Turkey are quickly increasing their Gold reserves.
Gold has an inverse correlation with the US Dollar and US Treasuries, which are both major reserve and safe-haven assets. When the Dollar depreciates, Gold tends to rise, enabling investors and central banks to diversify their assets in turbulent times. Gold is also inversely correlated with risk assets. A rally in the stock market tends to weaken Gold price, while sell-offs in riskier markets tend to favor the precious metal.
The price can move due to a wide range of factors. Geopolitical instability or fears of a deep recession can quickly make Gold price escalate due to its safe-haven status. As a yield-less asset, Gold tends to rise with lower interest rates, while higher cost of money usually weighs down on the yellow metal. Still, most moves depend on how the US Dollar (USD) behaves as the asset is priced in dollars (XAU/USD). A strong Dollar tends to keep the price of Gold controlled, whereas a weaker Dollar is likely to push Gold prices up.
Author

Sagar Dua
FXStreet
Sagar Dua is associated with the financial markets from his college days. Along with pursuing post-graduation in Commerce in 2014, he started his markets training with chart analysis.


