Gold Price Forecast: XAU/USD pressured on hotter than expected US CPI
- Gold is under pressure on the back of the US CPI beat.
- US yields and the US dollar take off, pressuring gold to the downside.

The gold price has dropped on the back of the main event for the week's outcome in the US Consumer Price Index. The yellow metal has fallen to $1,645 while the high of the day has been $1,682.49. Eyes are on 28 September's lows of $1,614.
The US dollar, as measured by the DXY index has shot to a high of 113.888 from the lows of 112.69. US yields have shot higher as well, with the 10-year Treasury yield touching 4.09%.
US CPI comes in hot
The data arrived as follows:
- US CPI (MoM) Sep: 0.4% (est 0.2%; prev 0.1%).
- US CPI (Y0Y) Sep: 8.2% (est 8.1%; prev 8.3%).
- US CPI Core (M0M) Sep: 0.6% (est 0.2%; prev 0.6%).
- US CPI Core (Y0Y) Sep: 6.6% (est 6.5%; prev 6.3%).
Once again, hotter-than-expected US inflation numbers for both the core and headline measures are not seen as good news for the Federal Reserve or the US economy. US short-term interest-rate traders see about a one-in-ten chance of a 100-basis point fed rate hike in November, up from zero before the CPI report. Consequently, US Dow futures dropped more than 350 points after a hotter-than-expected inflation report.
''Inflation's rising persistence suggests the Fed is unlikely to stop hiking preemptively, which points to a prolonged period of restrictive rates,'' analysts at TD Securities said. ''This suggests traders should ignore gold's siren calls, as a sustained downtrend will likely prevail''
Meanwhile, more data will be coming in from the US tomorrow with US Retail Sales. ''We look for retail sales to gain further momentum in September, following a 0.3% MoM rise in August,'' analysts at TD Securities said. ''Spending was likely boosted by another increase in auto sales and the first gain in gasoline station sales in three months. Importantly, control group sales likely stayed subdued, while those for the restaurants' segment likely slowed to a crawl following a 1.1% jump in August.''
Gold technical analysis
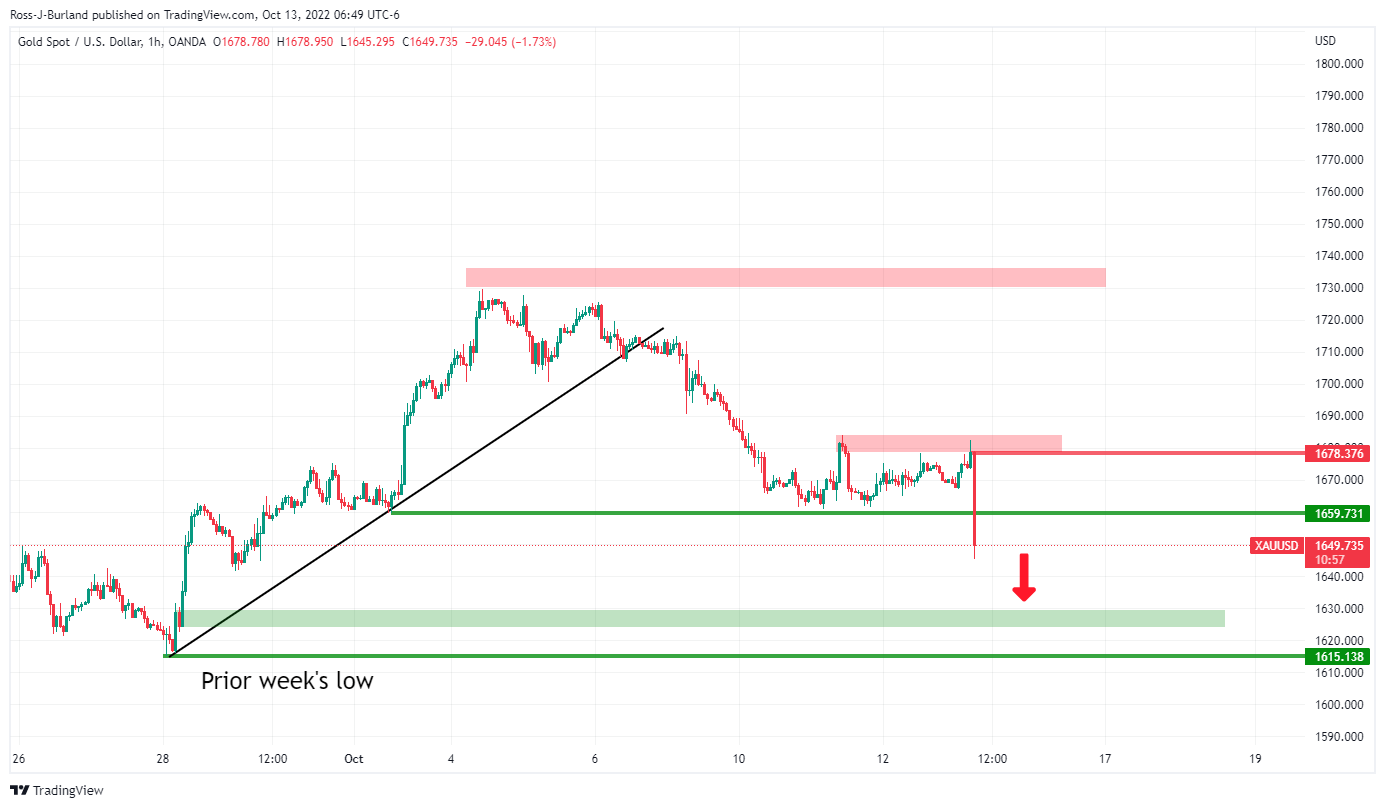
The price is on the way to the bottom of the prior bullish run with the 28 September lows in focus.
Author

Ross J Burland
FXStreet
Ross J Burland, born in England, UK, is a sportsman at heart. He played Rugby and Judo for his county, Kent and the South East of England Rugby team.


