|

Gold Price Forecast: XAU/USD oscillates around $1,810 on volatile DXY, focus is on Fed minutes

  • Gold price is hovering around $1,810.00 as investors await Fed minutes.
  • Investors will be delighted on having a detailed viewpoint of Fed policymakers towards the economy.
  • The expectations of the downbeat US NFP may keep the DXY on the edge.

Gold price (XAU/USD) is testing the upside break of the consolidation formed in a narrow range of $1,806.60-1,809.89 in the early Tokyo session. On a broader note, the precious metal has turned sideways after a firmer rebound from Friday’s low at $1,784.55.

The gold prices are likely to remain on the tenterhooks ahead of the release of the Federal Open Market Committee (FOMC) minutes on Wednesday. The detailed viewpoint from Federal Reserve (Fed) policymakers on the economic indicators of the US economy especially on the inflation rate and growth projections will support the market participants to adjust their positions on associated assets. Also, investors will be able to scrutiny the further direction of the yellow metal and US dollar index (DXY) in a more informed manner.

Meanwhile, the DXY is holding itself above the psychological resistance of 105.00 comfortably. The DXY is expected to remain sideways till the European session as higher volatility at the open leads to a contraction in the same. This week, apart from the Fed minutes, the US Nonfarm Payrolls (NFP) will be of significant importance. As per the market consensus, the US economy added 270k jobs in June, lower than the prior release of 390k.

Gold technical analysis

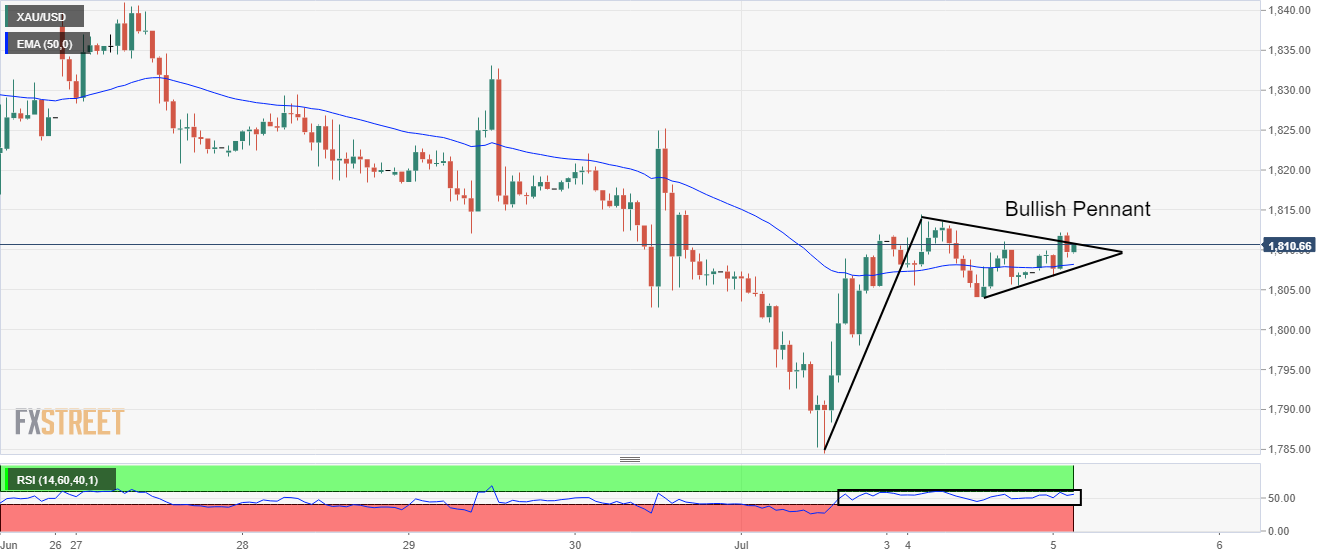
The gold prices are forming a Bullish Pennant chart pattern on an hourly scale that displays a consolidation phase, which is followed by a sheer upside move.  The consolidation phase indicates an initiative buying structure in which those investors initiate longs, which prefer to enter after an establishment of the trend. The precious metal is auctioning above the 50-period Exponential Moving Average (EMA) at $1,808.23, which indicates a bullish bias.

However, the Relative Strength Index (RSI) (14) is oscillating in a 40.00-60.00 range, which signals the unavailability of any potential trigger as it will continue the consolidation process.

Gold hourly chart

XAU/USD

Overview
Today last price1809.73
Today Daily Change2.53
Today Daily Change %0.14
Today daily open1807.2
 
Trends
Daily SMA201831.28
Daily SMA501845.67
Daily SMA1001891.02
Daily SMA2001845.74
 
Levels
Previous Daily High1814.37
Previous Daily Low1804.05
Previous Weekly High1841.05
Previous Weekly Low1784.55
Previous Monthly High1879.26
Previous Monthly Low1802.79
Daily Fibonacci 38.2%1807.99
Daily Fibonacci 61.8%1810.43
Daily Pivot Point S11802.71
Daily Pivot Point S21798.22
Daily Pivot Point S31792.39
Daily Pivot Point R11813.03
Daily Pivot Point R21818.86
Daily Pivot Point R31823.35

Author

Sagar Dua

Sagar Dua

FXStreet

Sagar Dua is associated with the financial markets from his college days. Along with pursuing post-graduation in Commerce in 2014, he started his markets training with chart analysis.

More from Sagar Dua
Share:

Editor's Picks

EUR/USD eyes nine-day EMA barrier after rebounding from 1.1600

EUR/USD gains ground after registering modest losses in the previous session, trading around 1.1620 during the Asian hours on Friday. The technical analysis of the daily chart suggests an ongoing bearish bias as the pair remains within the descending channel pattern.

GBP/USD drifts lower heading into NFP range

GBP/USD edged lower by 0.2% on Thursday, settling close to 1.3350 in a strained trading session that kept the pair pinned near three-month lows. Price briefly recovered earlier in the day on reports that Iran had indirectly signaled openness to talks with the CIA, but the bounce faded as Israeli officials reportedly advised Washington to disregard the overture. 

Gold awaits US Nonfarm Payrolls for a clear directional impetus

Gold rebounds above $5,100 early Friday after testing the $5,050 level amid global sell-off. The US Dollar pulls back as profit-taking creeps in ahead of US labor data. For February. 21-day SMA holds amid bullish RSI; a daily closing above 61.8% Fibo is critical for Gold buyers.

Ethereum pull in $169M as validators pile in to stake ETH

US spot Ethereum exchange-traded funds recorded $169 million in net inflows on Wednesday, marking the largest daily intake in two months, according to SoSoValue data. The rise in inflows signals renewed institutional interest in Ethereum amid broader market volatility.

The market compass is pointing at a barrel of Oil

The Asian open is arriving with equities leaning the wrong way, and the reason is not complicated. The market’s compass needle has snapped firmly toward crude. In this tape, oil is not just another input price; it is the gravitational center around which every asset class is orbiting.

Ripple tests recovery strength amid steady ETF inflows, growing retail interest

Ripple (XRP) continues to demonstrate notable resilience as the cryptocurrency market navigates the persistent war in the Middle East after the United States (US) and Israel attacked Iran on Saturday.