Gold Price Forecast: XAU/USD in search of fresh direction, key levels to watch – Confluence Detector
- Gold price picks up fresh bids but remains confined within a familiar range.
- Easing Omicron fears, Fed’s hawkish bets weigh on gold while USD recedes.
- Gold sellers eye $1,750 as Fed stays on tightening path.

Gold price is picking up from where it left on Monday, having witnessed a bearish start to a relatively quiet week. Easing concerns over the new Omicron covid variant combined with the faster-tapering expectations from the Fed next week are putting a lid on gold’s upside. Further, a strong technical hurdle around $1,792 and an upbeat market mood could also keep gold bulls at bay. All eyes remain on Friday’s US inflation data for the next direction in gold price.
Read: Gold Price Forecast: Depressed amid a better market mood
Gold Price: Key levels to watch
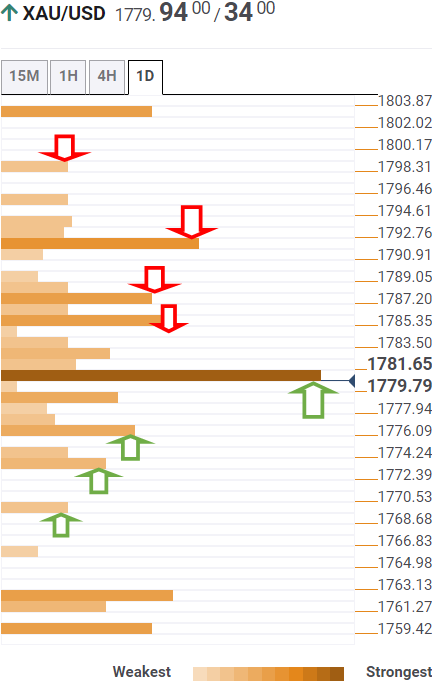
The Technical Confluences Detector shows that the gold price is trading just above the critical resistance now support at $1,780, where the SMA5 one-day, Fibonacci 38.2% one-week and one-day converge.
If gold bulls sustain above the latter, then a test of the $1,785 hurdle will be inevitable. That level is the confluence of the SMA50 four-hour and SMA200 one-hour.
Immediate upside will then be capped by the Fibonacci 23.6% one-month at $1,787.
Doors will further open up towards $1,792, the powerful supply zone comprising of the SMAs 50, 100 and 200 one-day. The Fibonacci 61.8% one-week also aligns at that point.
Buyers will look for fresh entries above the latter, with eyes on the $1800 level – the pivot point one-day R3.
On the flip side, a failure to resist above the aforesaid $1,780 barrier, will recall sellers to test the previous day’s low of $1,776. The SMA5 one-day appears at that level.
The next stop for gold bears is seen at $1,773, the Fibonacci 23.6% one-week, below which the pivot point one-day S2 at $1,769 could get tested.
Further south, a test of the November lows of $1,759 will be in the offing.
Here is how it looks on the tool
About Technical Confluences Detector
The TCD (Technical Confluences Detector) is a tool to locate and point out those price levels where there is a congestion of indicators, moving averages, Fibonacci levels, Pivot Points, etc. If you are a short-term trader, you will find entry points for counter-trend strategies and hunt a few points at a time. If you are a medium-to-long-term trader, this tool will allow you to know in advance the price levels where a medium-to-long-term trend may stop and rest, where to unwind positions, or where to increase your position size.
Author

Dhwani Mehta
FXStreet
Residing in Mumbai (India), Dhwani is a Senior Analyst and Manager of the Asian session at FXStreet. She has over 10 years of experience in analyzing and covering the global financial markets, with specialization in Forex and commodities markets.


