Gold Price Forecast: XAU/USD reverses intraday slide, flat-lined below $1,790 level
- Gold price rebounds from the Fed minutes-led sell-off to $1775.
- Risk-off mood weighs heavily on US yields, which drag the dollar lower.
- Gold Price Forecast: Downside potential for XAU/USD seems limited amid COVID-19 woes.

Update: Gold reversed an intraday dip to the $1,775-74 area and refreshed daily tops heading into the North American session, though lacked any follow-through. The prevalent risk-off environment – amid persistent COVID-19 jitters – continued driving flows towards traditional safe-haven assets and extended some support to the precious metal. However, expectations that the Fed will begin tapering its asset purchases later this year kept a lid on any meaningful upside for the non-yielding yellow metal.
The minutes of the July 27-28 FOMC meeting released on Wednesday revealed policymakers' assessment that progress was made towards maximum employment and price-stability goals. Investors now seem convinced that the Fed is comfortable to roll back the crisis-era stimulus and pushed the US dollar to the highest level since November 2020. This was seen as another factor that held bulls from placing aggressive bets and acted as a headwind for dollar-denominated commodities, including gold.
The USD held on to its intraday gains and had a rather muted reaction to mixed US economic releases. Data published by the US Department of Labor (DOL) showed that there were 348K initial claims for unemployment benefits during the week ending August 14, down from 377K previous. Separately, the Federal Reserve Bank of Philadelphia reported on Thursday that the headline Manufacturing Activity Index of the Manufacturing Business Outlook Survey dropped to 19.4 in August from 21.9.
Nevertheless, the fundamental backdrops warrant some caution before positioning for any firm direction. That said, hawkish Fed expectations might continue to underpin the USD and keep a lid on any runaway rally for gold as the focus now shifts to the Jackson Hole Symposium scheduled for 26 to 28 August.
Previous update: The risk-off market profile has once again come to the rescue of gold price, as it makes a tepid recovery attempt towards the $1800 mark. Coronavirus resurgence-induced economic growth concerns have spooked markets, boosting haven flows into US bonds, gold at the expense of the stocks and yields. The sell-off in the US Treasury yields capped the gains in the US dollar, prompting the rebound in gold price from four-day lows of $1775.
Gold price slid earlier on the day after the FOMC minutes raised the Fed’s tapering speculation. The Fed minutes indicated a willingness to start reducing asset purchases before the end of the year.
Read: Fed minutes underwhelm, as investor caution grows
Gold Price: Key levels to watch
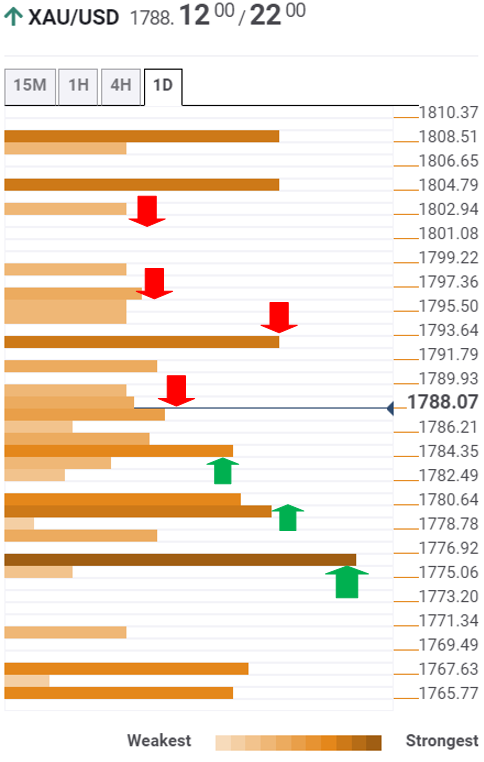
The Technical Confluences Detector shows that gold is testing a dense cluster of healthy resistance levels around $1788, which is the convergence of the Fibonacci 38.2% one-day, SMA50 one-hour and Bollinger Band one-day Middle.
If the abovementioned demand zone is cleared, then the bulls will challenge the Fibonacci 23.6% one-day at $1790.
Acceptance above the 61.8% one-month at $1793 is needed to encourage bullish traders.
The next crucial upside barrier is seen near $1796, where the pivot point one-day R1 coincides with the SMA200 four hour.
Further up, the $1800 threshold will come into play.
On the flip side, the Fibonacci 61.8% one-day at $1784 is the immediate cap, below which $1780 will emerge as fierce support.
That level is the confluence of the previous week’s high, SMA5 one-day and the pivot point one-day S1.
The intersection of the pivot point one-month S1 and the previous low four-hour at $1775 will test the bearish commitments should the downside resume.
Here is how it looks on the tool
About Technical Confluences Detector
The TCD (Technical Confluences Detector) is a tool to locate and point out those price levels where there is a congestion of indicators, moving averages, Fibonacci levels, Pivot Points, etc. If you are a short-term trader, you will find entry points for counter-trend strategies and hunt a few points at a time. If you are a medium-to-long-term trader, this tool will allow you to know in advance the price levels where a medium-to-long-term trend may stop and rest, where to unwind positions, or where to increase your position size.
Author

Dhwani Mehta
FXStreet
Residing in Mumbai (India), Dhwani is a Senior Analyst and Manager of the Asian session at FXStreet. She has over 10 years of experience in analyzing and covering the global financial markets, with specialization in Forex and commodities markets.


