Gold Price Forecast: XAU/USD eyes additional declines towards $1,735 – Confluence Detector
- Gold price is consolidating the downside before resuming the next downswing.
- The US dollar remains favored amid hawkish Fedspeak, firmer yields and risk-aversion.
- XAU/USD bears keep their sight on $1,735 below a sustained break of the $1,750 mark.

Gold price remains exposed to further downside risks amid notable US dollar demand so far this Friday. The greenback continues to build onto its recovery rally, helped by risk-averse market conditions amid mounting recession fears. The global bond market sell-off extends, as the central banks are likely to stick to their tightening path, in the face of raging inflation. The resultant spike in the Treasury yields is also boding well for the greenback while weighing down on the non-interest-bearing gold. The recent uptick in the buck has been triggered by the hawkish Fed commentary, as they continue to back a restrictive monetary policy until they are convinced that inflation has come down. Looking ahead, in absence of any top-tier US economic events, the repricing of Fed expectations and the end-of-the-week flows will play a pivotal role in the XAU/USD price action. All eyes now turn towards the Fed’s Jackson Hole Symposium next week.
Also read: Gold Price Forecast: XAU/USD bears aiming for $1,700, as focus shifts to Jackson Hole
Gold Price: Key levels to watch
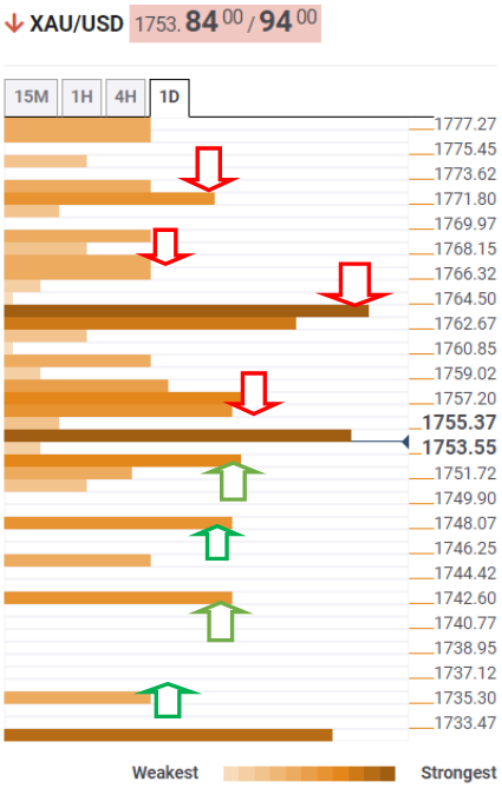
The Technical Confluence Detector shows that the gold price is yearning for a big break below the crucial support at around $1,750. At that level, the pivot point one-day S1, SMA200 four hour and the Bollinger Band four-hour Lower converge.
The further downside will open up towards the Fibonacci 161.8% one-week at $1,748. The next key support will be seen at the pivot point one-week S3 of $1,743.
A sustained move below the latter is critical to initiating a fresh decline towards $1,735, the pivot point one-day S3.
On the flip side, bulls need to clear the immediate resistance around $1,754-$1,755, where the previous day’s low meets with the pivot point one-week S2 and the SMA5 four-hour.
The next powerful upside hurdle is aligned at $1,763, the confluence of the Fibonacci 38.2% one-day, Fibonacci 61.8% one-month and SMA50 one-hour.
Further up, the Bollinger Band one-day Middle at $1,767 will challenge bearish commitments. The previous week’s low at $1,771 will be the last line of defense for XAU sellers.
Here is how it looks on the tool
About Technical Confluences Detector
The TCD (Technical Confluences Detector) is a tool to locate and point out those price levels where there is a congestion of indicators, moving averages, Fibonacci levels, Pivot Points, etc. If you are a short-term trader, you will find entry points for counter-trend strategies and hunt a few points at a time. If you are a medium-to-long-term trader, this tool will allow you to know in advance the price levels where a medium-to-long-term trend may stop and rest, where to unwind positions, or where to increase your position size.
Author

Dhwani Mehta
FXStreet
Residing in Mumbai (India), Dhwani is a Senior Analyst and Manager of the Asian session at FXStreet. She has over 10 years of experience in analyzing and covering the global financial markets, with specialization in Forex and commodities markets.


