Gold Price Forecast: XAU/USD bears aiming for $1,700, as focus shifts to Jackson Hole
- Gold price is meandering near three-week lows as King USD reigns supreme.
- Re-pricing of Fed expectations to drive the market, with eyes on Jackson Hole.
- XAU/USD’s daily technical setup opens the floor for a test of the $1,700 mark.

Gold price is licking its wounds, hovering close to three-week lows near $1,750, as the US dollar continues to capitalize on risk-off flows. The underlying central theme at the end of the week remains re-pricing of Fed rate hike expectations, especially after upbeat US Jobless Claims and Philly Fed Manufacturing Index reported a day before. Also, the Fed sentiment will hold the key to progressing towards the much-awaited Jackson Hole Symposium, scheduled next week. The probability of a 75 bps September rate hike now stands at 41%, up from 38% seen on Thursday, the CME Group’s FedWatch tool shows.
Meanwhile, the greenback is sitting at the highest level in a month near 107.70 against its major rivals, cheering the recent Fed commentary, where policymakers discussed the need for further interest rate hikes. San Francisco Fed President Mary Daly reiterated that it was way too early to declare victory on inflation, adding that they will continue to raise the rates to "right-size it." St. Louis Fed President James Bullard said he is leaning toward supporting a third straight 75-basis-point interest rate hike in September while Kansas City Fed President Esther George said she and her colleagues would not stop tightening policy until they are "completely convinced" that overheated inflation is coming down.
Also read: Gold Price Forecast: Bearish breakout underway
Looking ahead, the US economic calendar remains data-empty on the week's final trading day, leaving investors to reassess the cautious Fed minutes and the recent data flow. As mentioned above, it will be all about the Fed tightening expectations, with downside seemingly more likely for the bright metal, well-backed by the bearish technical setup on the daily chart.
Gold price technical outlook: Daily chart
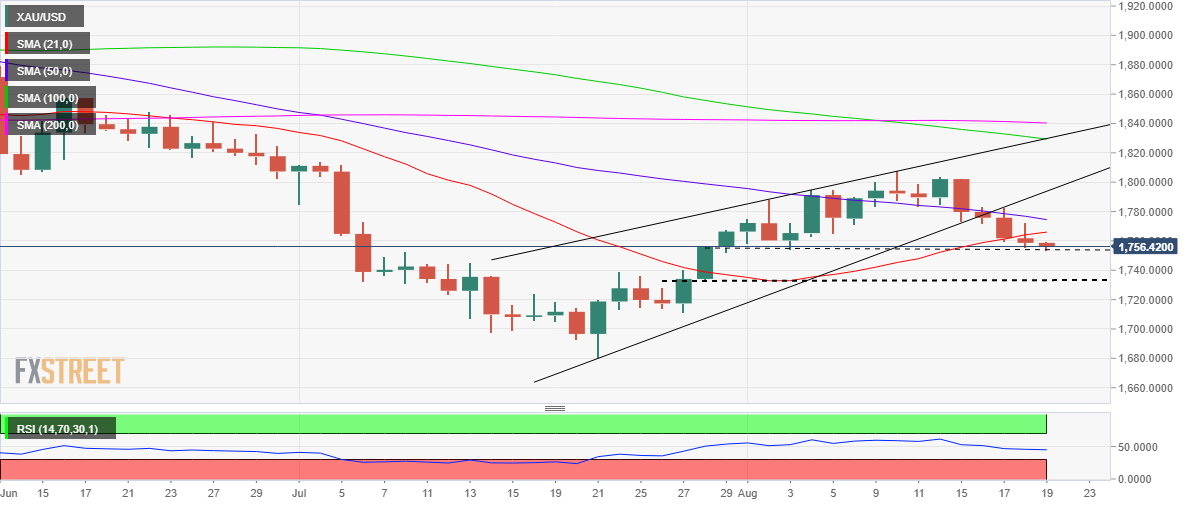
Earlier this week, the rising wedge breakdown confirmed on the daily chart keeps the downside open for gold bears.
Thursday’s close below the bullish 21-Daily Moving Average (DMA), now at $1,766, added credence to the bearish potential.
At the time of writing, the 14-day Relative Strength Index (RSI) points lower below the midline, suggesting that there is more for sellers to flex their muscles.
A sustained move below the $1,750 psychological level will be on their radars to aim for the next downside target near the $1,730 region.
Conversely, acceptance above the 21 DMA is crucial to initiate any meaningful recovery. However, the bearish 50 DMA at $1,774 will be a tough nut to crack for bulls.
Fresh buying opportunities above the latter could warrant a retest of Wednesday’s high at $1,782.
Premium
You have reached your limit of 3 free articles for this month.
Start your subscription and get access to all our original articles.
Author

Dhwani Mehta
FXStreet
Residing in Mumbai (India), Dhwani is a Senior Analyst and Manager of the Asian session at FXStreet. She has over 10 years of experience in analyzing and covering the global financial markets, with specialization in Forex and commodities markets.


