Gold Price Forecast: XAU/USD eyes $1,950 as the next bearish target – Confluence Detector
- Gold price is deep in the red amid risk-on mood, rallying US Treasury yields.
- Russia-Ukraine updates will continue to dictate risk sentiment, dollar trades.
- Gold Price appears vulnerable below $1,994, focus on yields, Ukraine updates.

Gold price is facing a double whammy from an improved market mood on hopes for diplomacy on the Ukraine crisis. While the expected 25 bps Fed rate hike this week is keeping the US Treasury yields on a stronger footing, The risk-on flows seem to be weighing down the US dollar, which cushions the downside in gold price. Looking ahead, the Russia-Ukraine war-related updates and risk sentiment will lead the way, in absence of first-tier economic data. Also, the US-Sino high-level talks to discuss Ukraine will be also closely followed.
Read: Russia-Ukraine: Five scenarios for the war and implications for stocks, the dollar, gold and oil
Gold Price: Key levels to watch
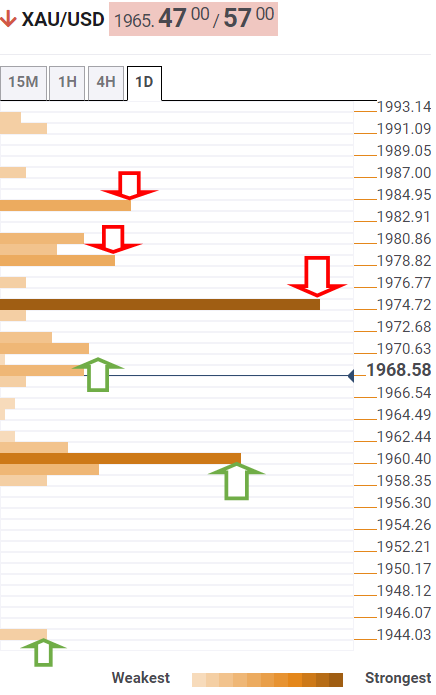
The Technical Confluences Detector shows that gold price is racing towards a critical demand area around $1,960, which is the convergence of the previous year’s high, the previous day’s low and the pivot point one-day S1.
If that confluence support gives way, then a sell-off towards the $1,950 psychological level will be inevitable.
The additional declines will accentuate the downtrend towards the SMA100 four-hour at $1,944, which will be the line in the sand for gold bulls.
Alternatively, should the abovementioned $1,960 support hold, then a rebound towards the $1,970 initial resistance cannot be ruled out. The SMA10 one-day, Fibonacci 23.6% one-day and the previous low four-hour meet around that level.
The intersection of the previous month’s high and Fibonacci 38.2% one-month at $1,975 will be a tough nut to crack for gold buyers on the road to recovery.
Further up, the SMA50 four-hour at $1,979 will test the bearish commitments, above which the powerful Fibonacci 61.8% one-day at $1,984 will be probed.
Here is how it looks on the tool
About Technical Confluences Detector
The TCD (Technical Confluences Detector) is a tool to locate and point out those price levels where there is a congestion of indicators, moving averages, Fibonacci levels, Pivot Points, etc. If you are a short-term trader, you will find entry points for counter-trend strategies and hunt a few points at a time. If you are a medium-to-long-term trader, this tool will allow you to know in advance the price levels where a medium-to-long-term trend may stop and rest, where to unwind positions, or where to increase your position size.
Author

Dhwani Mehta
FXStreet
Residing in Mumbai (India), Dhwani is a Senior Analyst and Manager of the Asian session at FXStreet. She has over 10 years of experience in analyzing and covering the global financial markets, with specialization in Forex and commodities markets.


