Gold Price Forecast: XAU/USD extends winning streak for seventh trading day
- Gold price jumps to near $3,550 amid meltdown in bonds globally.
- Rising bonds yields indicate mounting fiscal concerns.
- Investors await key US JOLTS Job Openings data for July.

Gold price (XAU/USD) extends its winning streak for the seventh trading day on Wednesday. The precious metal posts a fresh all-time high near $3,550 as investors have dumped long-dated government bonds across the globe.
Lower yields on interest-bearing assets increase demand for non-yielding assets, such as Gold.
Surging government bond yields signify mounting concerns over government fiscal debt, which often lead to a decline in welfare spending, and henceforth increases appeal of safe-haven bets.
Another reason behind strength in the Gold price is firm expectations that the Federal Reserve (Fed) will cut interest rates in the policy meeting this month. According to the CME FedWatch tool, there is an almost 92% chance that the Fed will cut interest rates in the September policy meeting.
Lower interest rates by the Fed bode well for non-yielding assets, such as Gold.
Lately, Federal Open Market Committee (FOMC) members supported interest rate cuts amid escalating downside employment risks.
Meanwhile, investors await United States (US) JOLTS Job Openings data for July, which will be published at 14:00 GMT. Investors will pay close attention to the job data to get cues about the current status of the labor demand.
US employers are expected to have posted fresh 7.4 million jobs, almost in line with the prior reading of 7.44 million.
Gold technical analysis
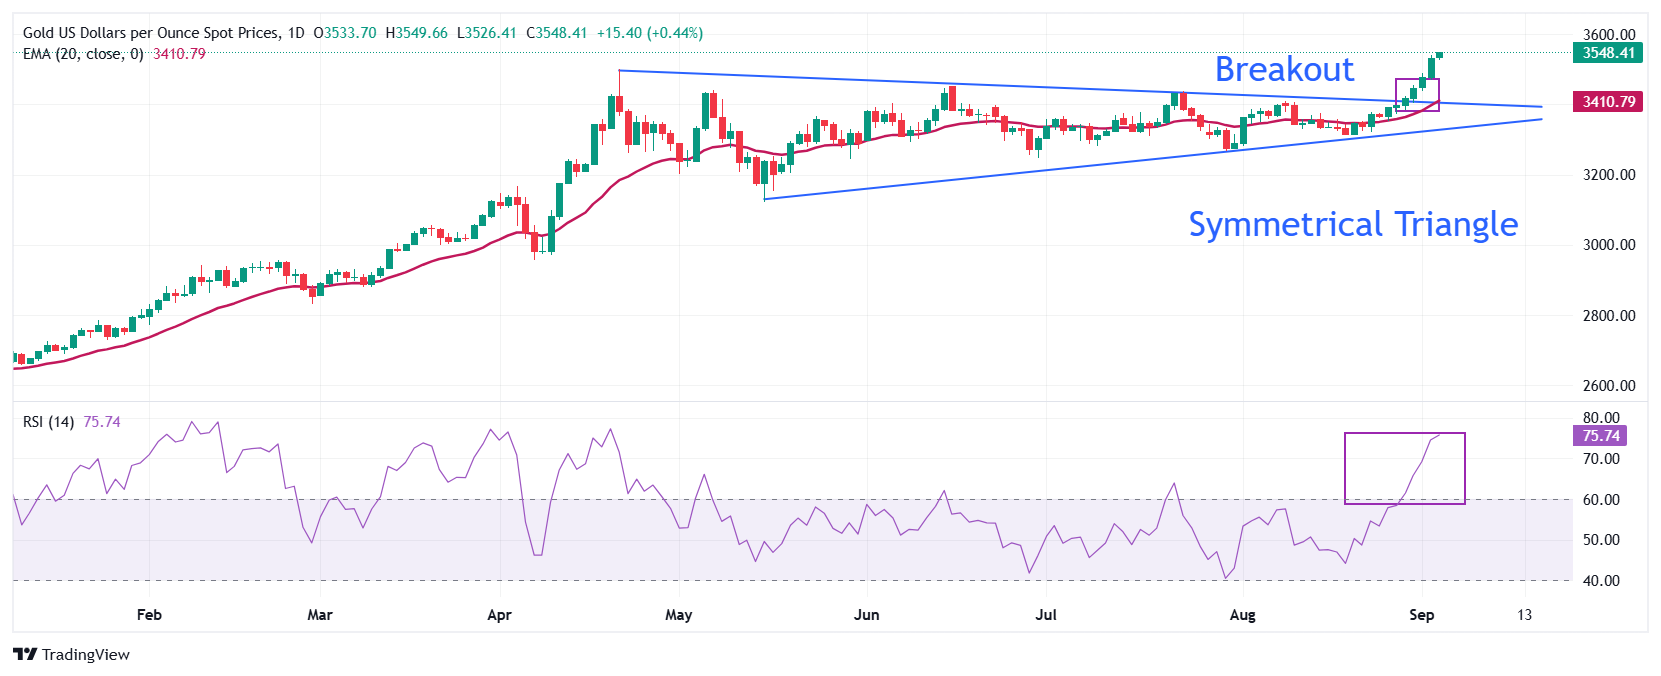
Gold price trades in uncharted territory after a breakout of the Symmetrical Triangle formation on a daily timeframe. A breakout of the above-mentioned chart pattern often leads to high volume and wider ticks on the upside.
Rising 20-day Exponential Moving Average (EMA) around $3,410 indicates that the near-term trend is bullish.
The 14-day Relative Strength Index (RSI) jumps to near 75.00. A corrective move in the Gold price looks likely as the momentum oscillator turns overbought.
Looking down, the 20-day will act as key support for the major. On the upside, the round figure of $3,600 would be the key hurdle for the pair.
Gold daily chart
Gold FAQs
Gold has played a key role in human’s history as it has been widely used as a store of value and medium of exchange. Currently, apart from its shine and usage for jewelry, the precious metal is widely seen as a safe-haven asset, meaning that it is considered a good investment during turbulent times. Gold is also widely seen as a hedge against inflation and against depreciating currencies as it doesn’t rely on any specific issuer or government.
Central banks are the biggest Gold holders. In their aim to support their currencies in turbulent times, central banks tend to diversify their reserves and buy Gold to improve the perceived strength of the economy and the currency. High Gold reserves can be a source of trust for a country’s solvency. Central banks added 1,136 tonnes of Gold worth around $70 billion to their reserves in 2022, according to data from the World Gold Council. This is the highest yearly purchase since records began. Central banks from emerging economies such as China, India and Turkey are quickly increasing their Gold reserves.
Gold has an inverse correlation with the US Dollar and US Treasuries, which are both major reserve and safe-haven assets. When the Dollar depreciates, Gold tends to rise, enabling investors and central banks to diversify their assets in turbulent times. Gold is also inversely correlated with risk assets. A rally in the stock market tends to weaken Gold price, while sell-offs in riskier markets tend to favor the precious metal.
The price can move due to a wide range of factors. Geopolitical instability or fears of a deep recession can quickly make Gold price escalate due to its safe-haven status. As a yield-less asset, Gold tends to rise with lower interest rates, while higher cost of money usually weighs down on the yellow metal. Still, most moves depend on how the US Dollar (USD) behaves as the asset is priced in dollars (XAU/USD). A strong Dollar tends to keep the price of Gold controlled, whereas a weaker Dollar is likely to push Gold prices up.
Author

Sagar Dua
FXStreet
Sagar Dua is associated with the financial markets from his college days. Along with pursuing post-graduation in Commerce in 2014, he started his markets training with chart analysis.

















