|

Gold Price Forecast: XAU/USD displays topsy-turvy moves post hawkish Fed, US PMI in focus

  • Gold price has turned sideways after a wild gyration, awaiting a fresh trigger for a decisive break.
  • Higher interest rates are forcing corporate to postpone their expansion plans.
  • The DXY is aiming to recapture the fresh two-decade high around 111.80.

Gold price (XAU/USD) is bewildered after gyrating in a wider range post the announcement of the monetary policy by the Federal Reserve (Fed). The precious metal bounced sharply after testing a two-year low at $1,654.50. However, the upside seems capped at around $1,685.00, which has shifted the yellow metal back inside the woods.

Federal Reserve (Fed)’s agenda of cooling down the ultra-hot inflation is hurting the corporate at most. Higher obligations on borrowings are forcing them to postpone their current expansion plans and drop investment in fruitful opportunities. This is resulting in a sheer decline in the growth projections and eventually in employment generation. Also, the housing sector is becoming a major victim as higher interest rates are resulting in higher monthly installments, which are forcing them to postpone their home-purchase plans.

Meanwhile, the US dollar index (DXY) is aiming to recapture the two-decade high of 111.81 ahead of S&P Global PMI data. As per the preliminary estimates, the Manufacturing PMI will land lower at 51.1 vs. the prior release of 51.5. While the Services PMI will improve to 45.0 against the prior print of 43.7.

Gold technical analysis

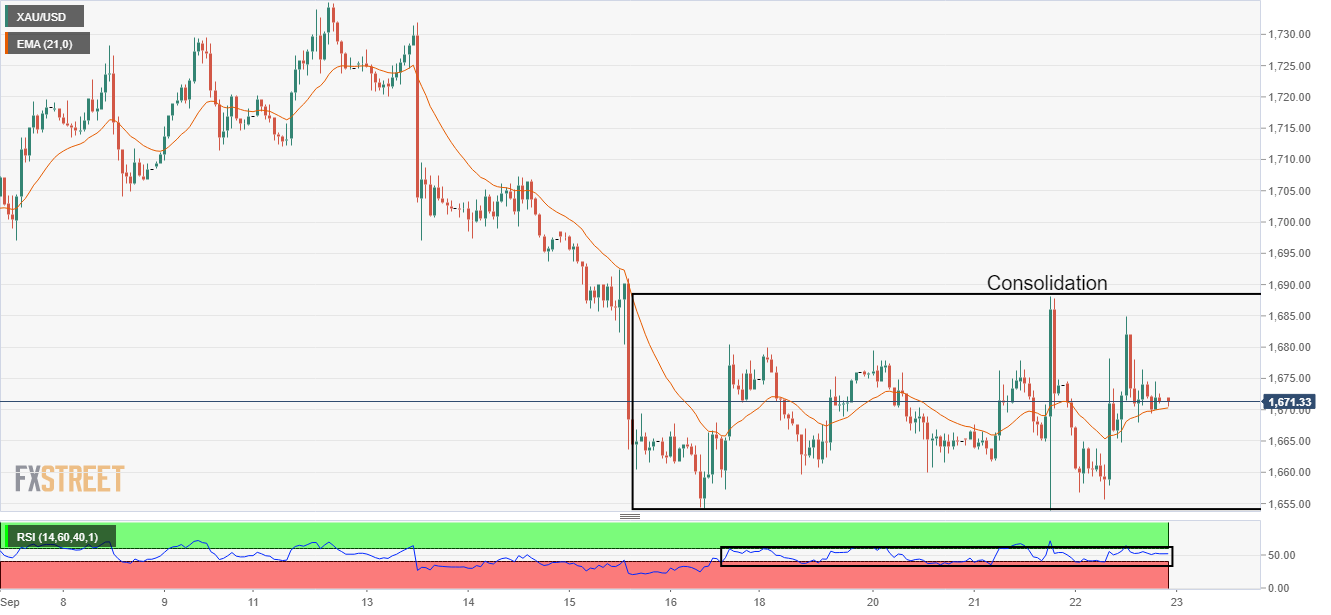
Gold price is displaying topsy-turvy moves in a wider range of $1,654.00-1,690.50 on an hourly scale. The 21-period Exponential Moving Average (EMA) at $1.670.00 is overlapping with the asset price, which signals a consolidation ahead.

Also, the Relative Strength Index (RSI) (14) is oscillating into the 40.00-60.00 range, which seeks a further trigger for a decisive move.

Gold hourly chart

XAU/USD

Overview
Today last price1671.06
Today Daily Change-2.88
Today Daily Change %-0.17
Today daily open1673.94
 
Trends
Daily SMA201705.74
Daily SMA501733.64
Daily SMA1001779.52
Daily SMA2001829.69
 
Levels
Previous Daily High1688.11
Previous Daily Low1653.97
Previous Weekly High1735.17
Previous Weekly Low1654.17
Previous Monthly High1807.93
Previous Monthly Low1709.68
Daily Fibonacci 38.2%1675.07
Daily Fibonacci 61.8%1667.01
Daily Pivot Point S11655.9
Daily Pivot Point S21637.87
Daily Pivot Point S31621.76
Daily Pivot Point R11690.04
Daily Pivot Point R21706.15
Daily Pivot Point R31724.18

Author

Sagar Dua

Sagar Dua

FXStreet

Sagar Dua is associated with the financial markets from his college days. Along with pursuing post-graduation in Commerce in 2014, he started his markets training with chart analysis.

More from Sagar Dua
Share:

Editor's Picks

EUR/USD eyes nine-day EMA barrier after rebounding from 1.1600

EUR/USD gains ground after registering modest losses in the previous session, trading around 1.1620 during the Asian hours on Friday. The technical analysis of the daily chart suggests an ongoing bearish bias as the pair remains within the descending channel pattern.

GBP/USD drifts lower heading into NFP range

GBP/USD edged lower by 0.2% on Thursday, settling close to 1.3350 in a strained trading session that kept the pair pinned near three-month lows. Price briefly recovered earlier in the day on reports that Iran had indirectly signaled openness to talks with the CIA, but the bounce faded as Israeli officials reportedly advised Washington to disregard the overture. 

Gold awaits US Nonfarm Payrolls for a clear directional impetus

Gold rebounds above $5,100 early Friday after testing the $5,050 level amid global sell-off. The US Dollar pulls back as profit-taking creeps in ahead of US labor data. For February. 21-day SMA holds amid bullish RSI; a daily closing above 61.8% Fibo is critical for Gold buyers.

Ethereum pull in $169M as validators pile in to stake ETH

US spot Ethereum exchange-traded funds recorded $169 million in net inflows on Wednesday, marking the largest daily intake in two months, according to SoSoValue data. The rise in inflows signals renewed institutional interest in Ethereum amid broader market volatility.

The market compass is pointing at a barrel of Oil

The Asian open is arriving with equities leaning the wrong way, and the reason is not complicated. The market’s compass needle has snapped firmly toward crude. In this tape, oil is not just another input price; it is the gravitational center around which every asset class is orbiting.

Ripple tests recovery strength amid steady ETF inflows, growing retail interest

Ripple (XRP) continues to demonstrate notable resilience as the cryptocurrency market navigates the persistent war in the Middle East after the United States (US) and Israel attacked Iran on Saturday.