Gold Price Forecast: XAU/USD corrects lower ahead of US CPI
- Gold pulls back toward $4,050 as the US Dollar rebounds and traders take profits after India's Diwali.
- Market focus shifts to the upcoming US CPI data, expected to guide Fed rate expectations.
- Gold consolidates within a symmetrical triangle, with a potential breakout around the US CPI release.

Gold (XAU/USD) retreats on Friday, trading around $4,050 per ounce at the time of writing, down 1.75% for the day, as renewed demand for the US Dollar (USD) and profit-taking weigh on the yellow metal. The end of the Diwali festival in India, the world’s second-largest Gold consumer, is also expected to reduce physical demand in the short term.
Traders remain cautious ahead of the release of the US Consumer Price Index (CPI) for September, due later in the day.
Despite the latest correction, the broader environment still provides underlying support for Gold. The ongoing US government shutdown, now in its 24th day, continues to undermine confidence, while persistent trade tensions between Washington and Beijing sustain demand for safe-haven assets.
Meanwhile, markets remain nearly certain that the Federal Reserve (Fed) will cut interest rates by 25 basis points at its October meeting, and again in December, according to the CME FedWatch tool. Lower interest rates tend to reduce the opportunity cost of holding non-yielding assets such as Gold, potentially limiting further downside.
Gold technical analysis: XAU/USD consolidates within a triangle ahead of CPI
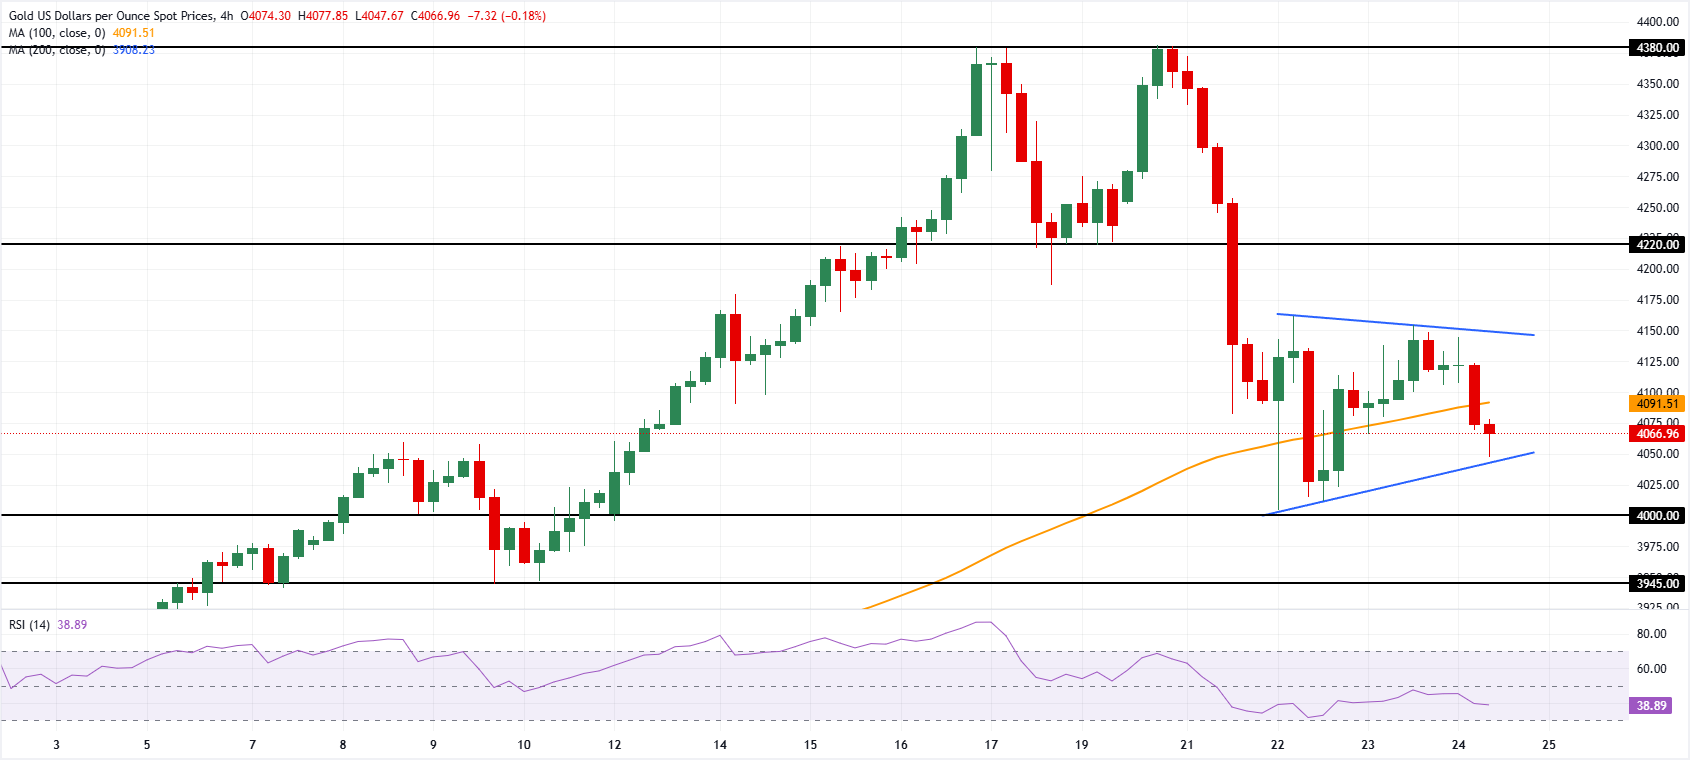
XAU/USD 4-hour chart. Source: FXStreet.
Gold remains broadly in consolidation within a symmetrical triangle pattern on the 4-hour chart following a sharp correction from this week’s $4,381 record high set on Monday. Traders await the CPI release, which could serve as the catalyst for a breakout. The pattern’s boundaries currently lie between $4,040 and $4,150, defining the near-term range.
On the downside, a decisive break below $4,040 could expose the psychological level at $4,000, near Wednesday’s low of $4,004. Below that, further declines could extend toward the October 9–10 lows around $3,945. The Relative Strength Index (RSI) on the 4-hour chart remains steady between 30 and 50, suggesting continued short-term bearish potential.
Conversely, a move above $4,150 would strengthen the prospects for a more pronounced rebound, initially targeting the former support zone near $4,220 and, if bullish momentum persists, a retest of recent all-time highs around $4,380.
Author

Ghiles Guezout
FXStreet
Ghiles Guezout is a Market Analyst with a strong background in stock market investments, trading, and cryptocurrencies. He combines fundamental and technical analysis skills to identify market opportunities.


