|

Gold Price Forecast: XAU/USD continues to juggle above $1,900 despite US Inflation softens

  • Gold price is struggling to come out of the woods despite the continuation of declining US Inflation.
  • The USD Index is defending the critical support of 103.50 but looks prone to the further downside amid the risk-on mood.
  • Monthly US Retail Sales data is expected to contract by 0.3% vs. the former release of 3% expansion.

Gold price (XAU/USD) is inside the woods despite the United States inflation figures meeting expectations. The precious metal is continuously oscillating in a narrow range of $1,895-1,913 from Monday. The release of the US Consumer Price Index (CPI) failed to deliver a power-pack action in the Gold price, however, the upside bias looks solidified as bets for smaller rate hikes from the Federal Reserve (Fed) have soared.

The US Dollar Index (DXY) is defending the critical support of 103.50 but looks prone to the further downside as investors’ risk appetite has improved dramatically. S&P500 futures witnessed responsive buying from the market participants as higher odds of a smaller rate hike from Fed chair Jerome Powell might postpone a likely recession in the US economy, portraying a sheer recovery in overall optimism.

Contrary to the risk-on mood, the demand for US Treasury bonds remained vulnerable, which led the 10-year US Treasury yields higher above 3.68%.

The headline US CPI was expanded by 0.4% on a monthly basis, as expected and the annual figure softened to 6.0% from the former release of 6.4%.  And, the core CPI that excludes oil and food prices dropped marginally to 5.5% from the former release of 5.6%. The continuation of a declining trend in the US inflation seems delightful for the Fed.

Going forward, investors will keep an eye on the US Retail Sales (Feb) data. Monthly Retail Sales data is expected to contract by 0.3% vs. the former release of 3% expansion. This indicates that resilience in consumer spending is over and the Fed is on track of achieving the 2% inflation target.

Gold technical analysis

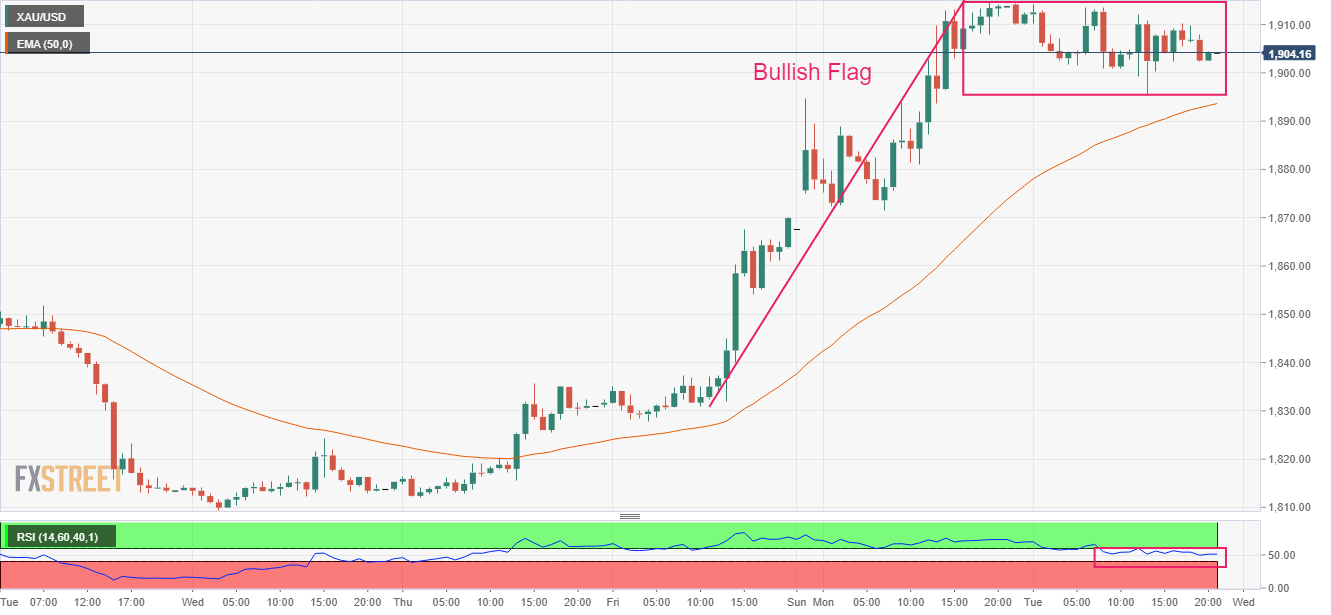
Gold price is forming a Bullish Flag chart pattern on an hourly scale, which indicates a continuation of the bullish momentum after the breakout of a consolidation. Usually, the consolidation phase of the chart pattern serves as an inventory adjustment in which those participants initiate longs, which prefer to enter an auction after the establishment of a bullish bias.

Advancing 50-period Exponential Moving Average (EMA) at $1,894.00 add to the upside filters.

The Relative Strength Index (RSI) (14) is oscillating in a bullish range of 40.00-60.00. A break into the bullish range of 60.00-80.00 will trigger the upside momentum.

Gold hourly chart

XAU/USD

Overview
Today last price1904.16
Today Daily Change-9.61
Today Daily Change %-0.50
Today daily open1913.77
 
Trends
Daily SMA201838.45
Daily SMA501872.87
Daily SMA1001813.1
Daily SMA2001775.42
 
Levels
Previous Daily High1914.67
Previous Daily Low1867.66
Previous Weekly High1870.09
Previous Weekly Low1809.46
Previous Monthly High1959.8
Previous Monthly Low1804.76
Daily Fibonacci 38.2%1896.71
Daily Fibonacci 61.8%1885.62
Daily Pivot Point S11882.73
Daily Pivot Point S21851.69
Daily Pivot Point S31835.72
Daily Pivot Point R11929.74
Daily Pivot Point R21945.71
Daily Pivot Point R31976.75

Author

Sagar Dua

Sagar Dua

FXStreet

Sagar Dua is associated with the financial markets from his college days. Along with pursuing post-graduation in Commerce in 2014, he started his markets training with chart analysis.

More from Sagar Dua
Share:

Markets move fast. We move first.

Orange Juice Newsletter brings you expert driven insights - not headlines. Every day on your inbox.

By subscribing you agree to our Terms and conditions.

Editor's Picks

EUR/USD bears await break below 100-day SMA support near 1.1665 area

The EUR/USD pair attracts heavy selling for the second straight day and dives to a nearly four-week trough, around the 1.1670 region, during the Asian session on Monday. Bearish traders now await a sustained break below the 100-day Simple Moving Average before positioning for an extension of the recent pullback from a three-month top, or levels just above the 1.1800 mark touched on December 24.

GBP/USD falls toward 1.3400 near 50-day EMA

GBP/USD extends its losses for the second successive session, trading around 1.3420 during the Asian hours on Monday. The technical analysis of the daily chart indicates that the 14-day Relative Strength Index at 53 has eased from near overbought, indicating that momentum has cooled while remaining above the midline. RSI holds above 50, keeping a modest bullish bias.

Gold on fire at the start of the week on US-Venezuela tensions

Gold regains upside traction early Monday as flight to safety prevails on Venezuela turmoil. The US Dollar finds strong haven demand, caps Gold’s upside as focus shifts to US jobs data. Gold’s daily technical setup suggests that more upside remains in the offing.

Bulls firmly in control as Bitcoin breaks $93K, Ethereum and Ripple extend gains

Bitcoin, Ethereum, and Ripple extended their rallies on Monday, gaining more than 4%, 6%, and 12%, respectively, in the previous week. The top three cryptocurrencies by market capitalization could continue to outperform, with bulls in control of the momentum.

Economic outlook 2026-2027 in advanced countries: Solidity test

After a year marked by global economic resilience and ending on a note of optimism, 2026 looks promising and could be a year of solid economic performance. In our baseline scenario, we expect most of the supportive factors at work in 2025 to continue to play a role in 2026.

Meme Coins Price Prediction: Dogecoin, Shiba Inu, Pepe rally on Venezuela’s shadow BTC reserve

Meme coins such as Dogecoin, Shiba Inu, and Pepe are leading the cryptocurrency market rally driven by the US cross-border operation to capture Venezuelan President Nicolás Maduro. Dogecoin extends its gain for the fifth consecutive day while SHIB and PEPE take a pause.