Gold Price Forecast: XAU/USD breaks support as market looks for next catalyst
- Gold trades below key $3,200 support as bearish pressure builds after recent highs.
- XAU/USD consolidates within a bullish pennant, signaling potential trend continuation if support holds.
- A surge in momentum below $3,200 may trigger a deeper retracement toward key Fibonacci levels.

Gold prices remain under pressure as investors reassess the interest rate outlook and digest mixed signals from recent US economic data. At the time of writing, XAU/USD is down 2.23% on the day, trading below $3,200, extending a week-to-date decline of 4.26%.
The pullback reflects uncertainty surrounding the Federal Reserve’s (Fed) policy stance, as softer inflation data clash with firm labor market conditions. This macro backdrop has kept Gold range-bound just below its all-time high, with traders looking for fresh direction.
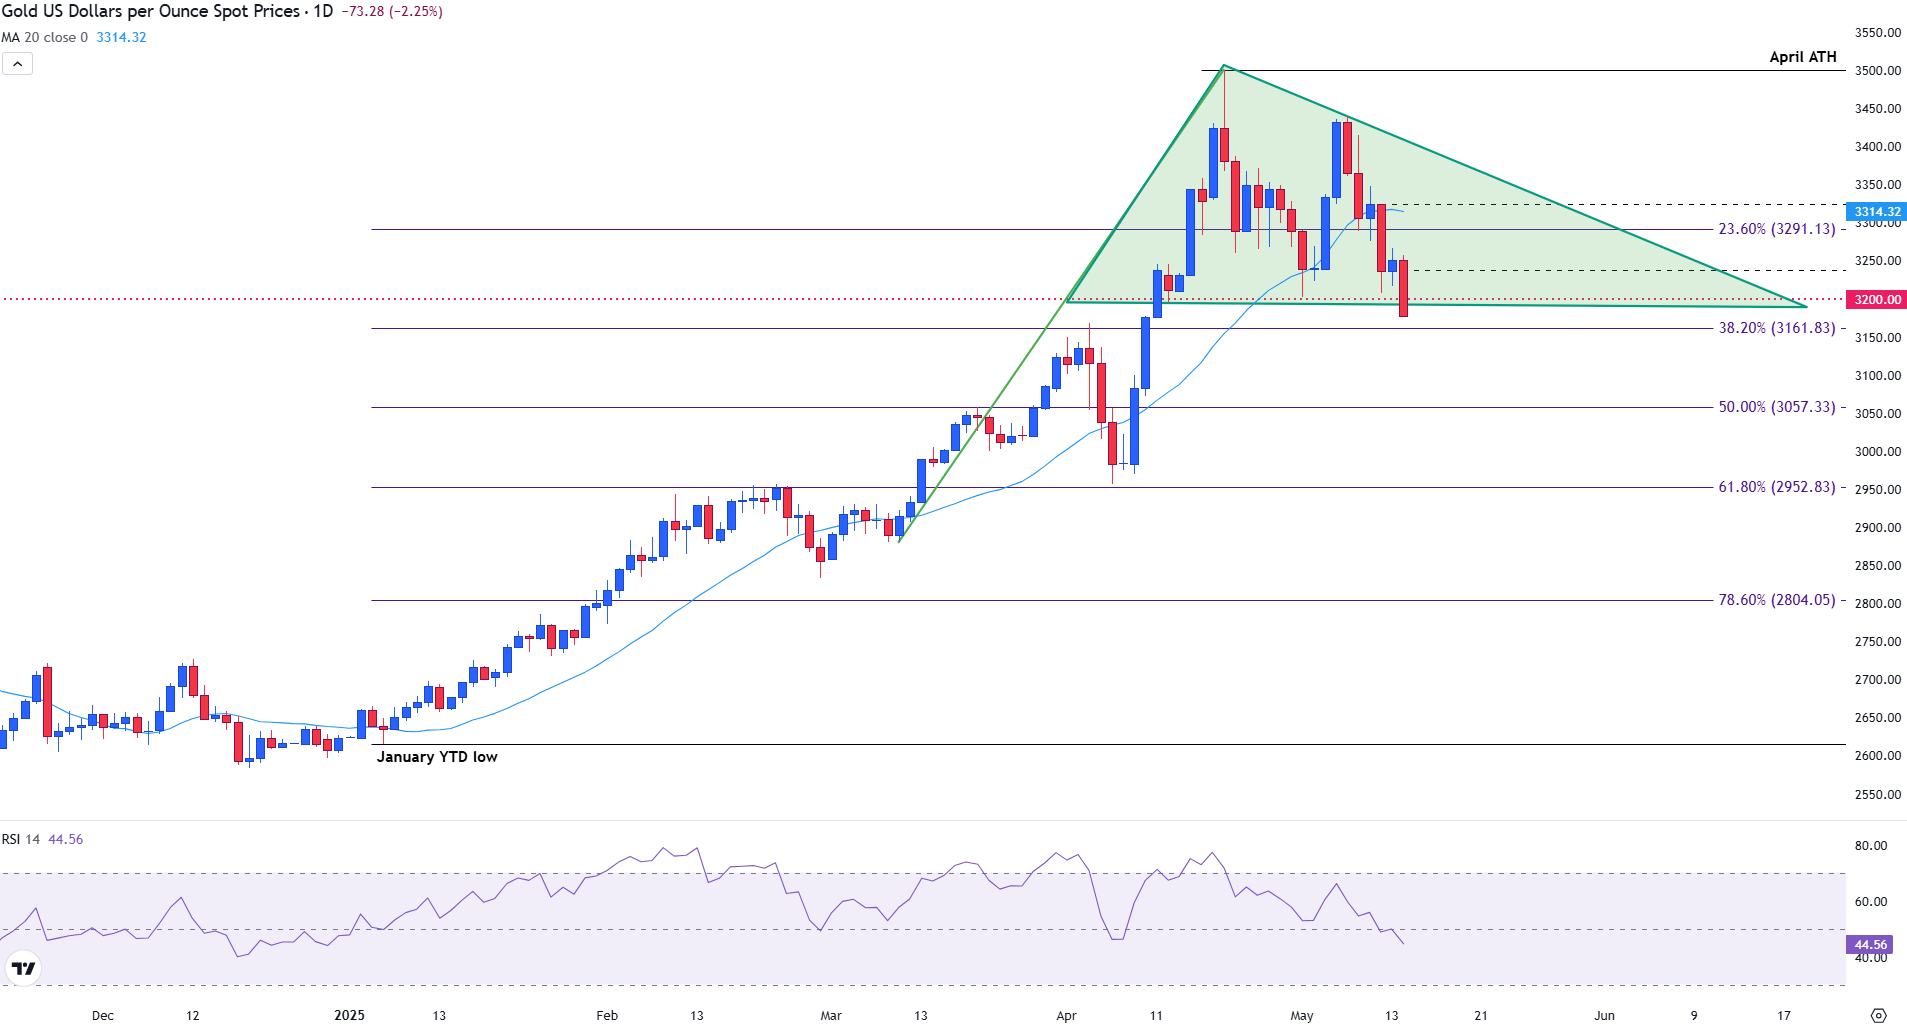
Gold bears test bullish pennant support
On the daily chart, Gold has formed a bullish pennant, a continuation pattern that typically signals a potential resumption of the prevailing uptrend. The April surge forms the flagpole, while current price action is consolidating within converging trendlines, indicating tightening market conditions and indecision among market participants.
However, the integrity of the pattern is now under pressure. Price has slipped below the 20-day Simple Moving Average (SMA), currently at $3,316.20, reflecting short-term weakness. Additionally, the Relative Strength Index (RSI) has declined to 47.13, pointing to neutral-to-bearish momentum. These developments suggest that the bullish setup may be faltering.
The immediate focus is on the horizontal support at $3,200, which marks the lower boundary of the pennant. With prices currently below this level, a confirmed break would invalidate the pattern and likely trigger a deeper correction. Conversely, a move above $3,300, particularly if it clears the descending trendline resistance, would reaffirm the bullish bias and potentially open the path to new highs.
Gold (XAU/USD) daily chart
Gold slips below $3,200 as bullish momentum fades
From a broader perspective, the weekly chart shows that Gold remains in a consolidation phase following its ascent to a record high of $3,500 in April. This advance was underpinned by safe-haven demand and market expectations of future interest rate cuts. However, the rally was quickly met with profit-taking, evidenced by a long upper shadow on the weekly candle — a signal of rejection and growing resistance.
Since that peak, Gold has traded within a narrow horizontal band between $3,200 and $3,300, representing a pause in the uptrend rather than a full reversal. The long-term bullish structure remains intact, supported by an ascending trendline originating from the January low. Importantly, price is still holding above the 23.6% Fibonacci retracement level at $3,291, drawn from the January low to the April high.
Gold (XAU/USD) weekly chart
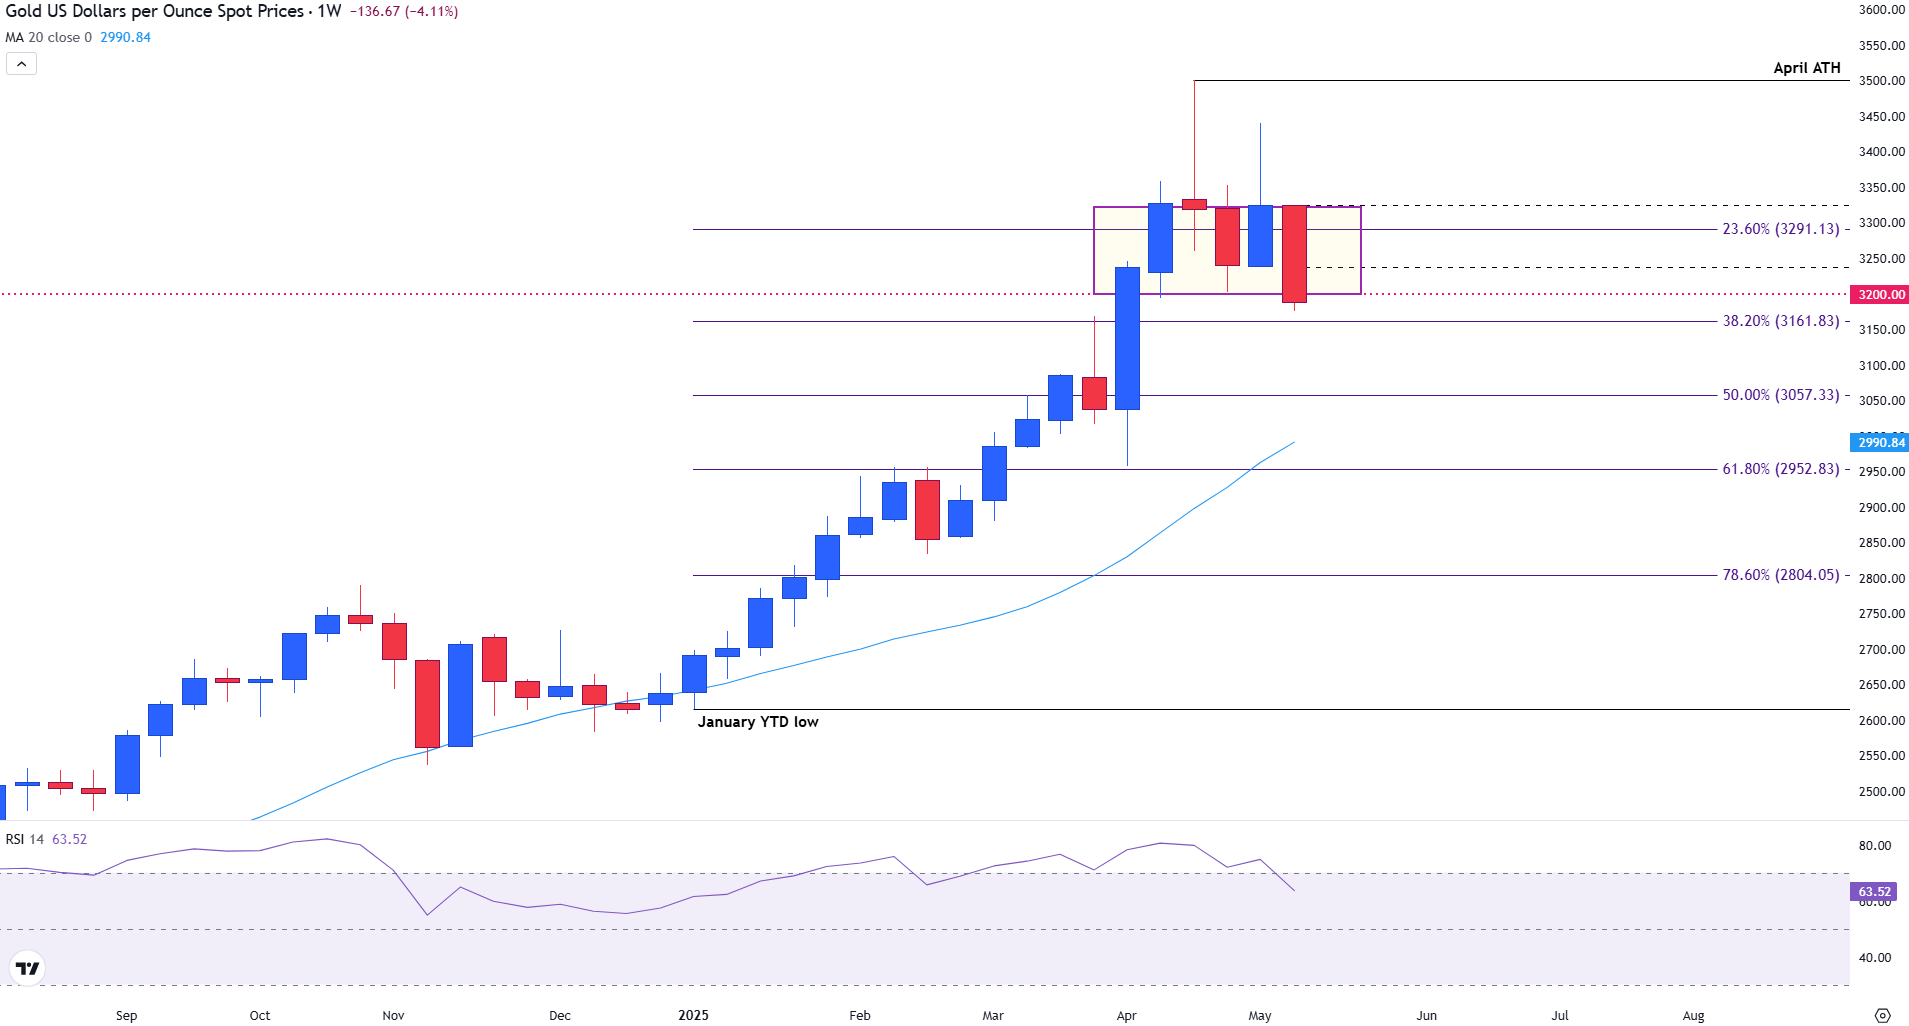
While the broader trend favors the bulls, the near-term outlook hinges on how price behaves within the pivotal $3,200–$3,300 range.
A decisive breakout above $3,300, especially if accompanied by rising momentum and a break of descending trendline resistance, would confirm the continuation of the broader uptrend. In this scenario, Gold could retest the $3,450–$3,500 area.
A confirmed breakdown below $3,200 would invalidate the pennant structure and expose Gold to deeper retracements, with support levels at $3,161 (38.2% Fibonacci) and $3,057 (50.0%) offering potential downside targets.
Until a breakout occurs, Gold is likely to remain range-bound, with short-term direction dictated by incoming macroeconomic data and Fed policy signals.
Gold FAQs
Gold has played a key role in human’s history as it has been widely used as a store of value and medium of exchange. Currently, apart from its shine and usage for jewelry, the precious metal is widely seen as a safe-haven asset, meaning that it is considered a good investment during turbulent times. Gold is also widely seen as a hedge against inflation and against depreciating currencies as it doesn’t rely on any specific issuer or government.
Central banks are the biggest Gold holders. In their aim to support their currencies in turbulent times, central banks tend to diversify their reserves and buy Gold to improve the perceived strength of the economy and the currency. High Gold reserves can be a source of trust for a country’s solvency. Central banks added 1,136 tonnes of Gold worth around $70 billion to their reserves in 2022, according to data from the World Gold Council. This is the highest yearly purchase since records began. Central banks from emerging economies such as China, India and Turkey are quickly increasing their Gold reserves.
Gold has an inverse correlation with the US Dollar and US Treasuries, which are both major reserve and safe-haven assets. When the Dollar depreciates, Gold tends to rise, enabling investors and central banks to diversify their assets in turbulent times. Gold is also inversely correlated with risk assets. A rally in the stock market tends to weaken Gold price, while sell-offs in riskier markets tend to favor the precious metal.
The price can move due to a wide range of factors. Geopolitical instability or fears of a deep recession can quickly make Gold price escalate due to its safe-haven status. As a yield-less asset, Gold tends to rise with lower interest rates, while higher cost of money usually weighs down on the yellow metal. Still, most moves depend on how the US Dollar (USD) behaves as the asset is priced in dollars (XAU/USD). A strong Dollar tends to keep the price of Gold controlled, whereas a weaker Dollar is likely to push Gold prices up.
Author

Tammy Da Costa, CFTe®
FXStreet
Tammy is an economist and market analyst with a deep passion for financial markets, particularly commodities and geopolitics.


