Gold Price Forecast: XAU/USD braces for 2021 low of $1,677 in a volatile week – Confluence Detector
- Gold price re-attempts $1,700 amid a dead cat bounce, pre-NFP caution.
- Aggressive global tightening bets, China covid lockdowns keep investors on the edge.
- XAU/USD closed Thursday below $1,700, bears target $1,681 and $1,677.

Gold price is attempting a dead cat bounce from six-week lows of $1,689, as investors reposition in the run-up to the critical US Nonfarm Payrolls release. Gold traders refrain from placing any directional bets, as the US payrolls data will likely have a significant impact on the Fed’s rate hike pricing for this month. Heading into the US jobs report, markets are wagering a 74% probability of a 75 bps September rate hike. With the US economy expected to have added 300K jobs in August, the dollar remains in a win-win position, as hawkish Fed rate hike expectations and China’s fresh covid lockdown in Chengdu-led risk-aversion will continue favoring the dollar bulls. The bright metal, therefore, remains at risk of further decline should the recovery attempt fade. The US Treasury yields hovering near multi-year highs will also keep any rebound in the bullion checked.
Also read: US August Nonfarm Payrolls Preview: Analyzing gold's reaction to NFP surprises
Gold Price: Key levels to watch
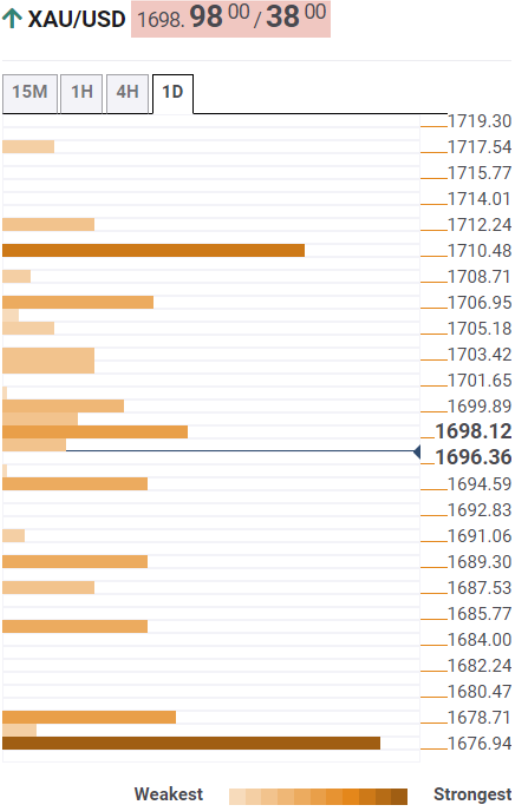
The Technical Confluence Detector shows that the gold price needs to find acceptance above the Fibonacci 61.8% one-day at $1,703 to extend the recovery towards the pivot point one-week S2 at $1,707.
The next powerful resistance for bulls is seen around $1,710, where the pivot point one-day R1 and the previous month’s low coincide.
If the downside resumes momentum, then bears will aim for the immediate cap at $1,694, the Fibonacci 23.6% one-day.
Further south, the confluence of the previous day’s low and the pivot point one-day S1 around $1,688 will be challenged.
The 2022 lows of $1,681 will be next on sellers’ radars, below which a test of the 2021 low of $1,677 will be on the table.
Here is how it looks on the tool
About Technical Confluences Detector
The TCD (Technical Confluences Detector) is a tool to locate and point out those price levels where there is a congestion of indicators, moving averages, Fibonacci levels, Pivot Points, etc. If you are a short-term trader, you will find entry points for counter-trend strategies and hunt a few points at a time. If you are a medium-to-long-term trader, this tool will allow you to know in advance the price levels where a medium-to-long-term trend may stop and rest, where to unwind positions, or where to increase your position size.
Author

Dhwani Mehta
FXStreet
Residing in Mumbai (India), Dhwani is a Senior Analyst and Manager of the Asian session at FXStreet. She has over 10 years of experience in analyzing and covering the global financial markets, with specialization in Forex and commodities markets.


