- Gold price is making efforts for recovery from $1,940.00 as the focus shifts to US Services PMI.
- After the release of downbeat Manufacturing PMI, weak service sector performance could propel volatility in the USD Index.
- The yields offered on 10-year US government bonds are holding gains above 3.74%.
Gold price (XAU/USD) has defended its downside after a fresh four-day low around $1,940.00 in the New York session. The precious metal is expected to deliver a power-pack action as the United States ISM agency is going to release Services PMI numbers for May.
After the release of the downbeat Manufacturing PMI last week, a downbeat performance from the service sector could propel volatility in the US Dollar Index (DXY). US factory activity reported a seventh straight contraction as firms are failing to cater to their fixed and working capital requirements amid higher interest rates by the Federal Reserve (Fed) and tight credit conditions by US regional banks.
According to the preliminary report, US Services PMI is seen declining to 51.5 vs. the prior release of 51.9. New Orders Index that conveys forward demand is seen advancing to 56.5 against the former release of 56.1.
At the press time, the USD Index has faced marginal pressure while attempting to cross the immediate resistance of 104.40. After the release of upbeat US Nonfarm Payrolls data, it is critical to discuss about interest rate policy from Fed. The investing community will get more clarity after getting inflation figures for May ahead.
Meanwhile, S&P500 are expected to open on a mildly bullish note. US equities are expected to continue Friday’s optimism amid consistent macros. The yields offered on 10-year US government bonds are holding gains above 3.74%.
Gold technical analysis
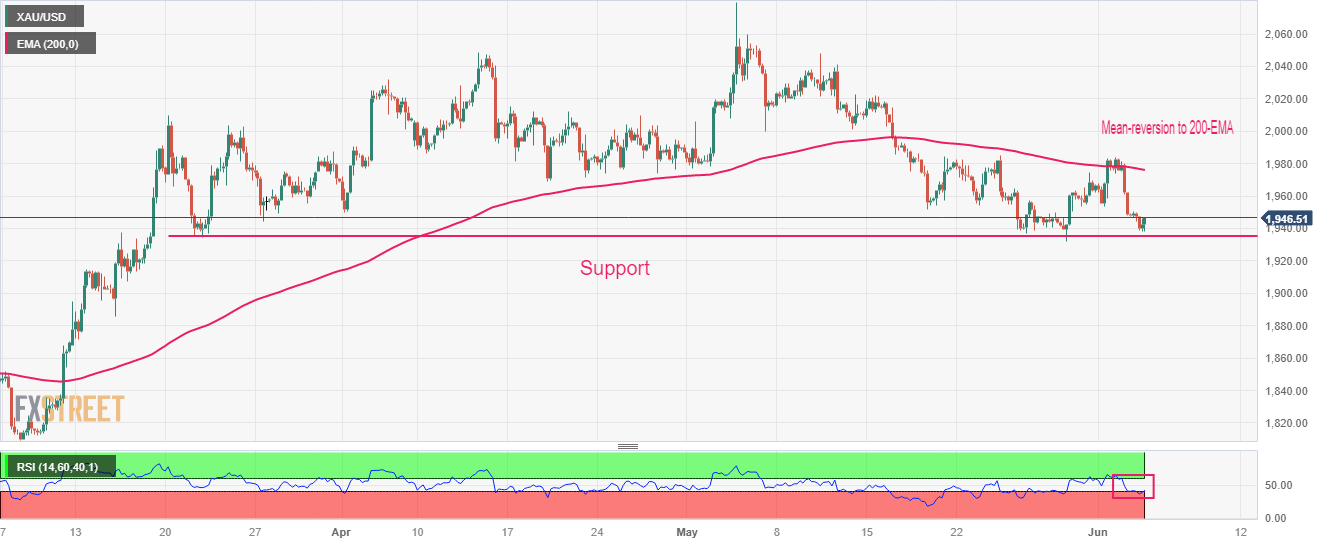
Gold price witnessed an intense sell-off after a mean-reversion move to near the 200-period Exponential Moving Average (EMA) at $1,977.32 on a four-hour scale. The precious metal is declining toward the key support plotted from March 22 low at $1,934.34.
The Relative Strength Index (RSI) (14) is hovering near the 40.00 threshold. Bearish momentum will get triggered on a breakdown into the 20.00-40.00 range.
Gold four-hour chart
Information on these pages contains forward-looking statements that involve risks and uncertainties. Markets and instruments profiled on this page are for informational purposes only and should not in any way come across as a recommendation to buy or sell in these assets. You should do your own thorough research before making any investment decisions. FXStreet does not in any way guarantee that this information is free from mistakes, errors, or material misstatements. It also does not guarantee that this information is of a timely nature. Investing in Open Markets involves a great deal of risk, including the loss of all or a portion of your investment, as well as emotional distress. All risks, losses and costs associated with investing, including total loss of principal, are your responsibility. The views and opinions expressed in this article are those of the authors and do not necessarily reflect the official policy or position of FXStreet nor its advertisers. The author will not be held responsible for information that is found at the end of links posted on this page.
If not otherwise explicitly mentioned in the body of the article, at the time of writing, the author has no position in any stock mentioned in this article and no business relationship with any company mentioned. The author has not received compensation for writing this article, other than from FXStreet.
FXStreet and the author do not provide personalized recommendations. The author makes no representations as to the accuracy, completeness, or suitability of this information. FXStreet and the author will not be liable for any errors, omissions or any losses, injuries or damages arising from this information and its display or use. Errors and omissions excepted.
The author and FXStreet are not registered investment advisors and nothing in this article is intended to be investment advice.
Recommended content
Editors’ Picks

EUR/USD bounces off lows, retests 1.1370
Following an early drop to the vicinity of 1.1310, EUR/USD now manages to regain pace and retargets the 1.1370-1.1380 band on the back of a tepid knee-jerk in the US Dollar, always amid growing optimism over a potential de-escalation in the US-China trade war.

GBP/USD trades slightly on the defensive in the low-1.3300s
GBP/USD remains under a mild selling pressure just above 1.3300 on Friday, despite firmer-than-expected UK Retail Sales. The pair is weighed down by a renewed buying interest in the Greenback, bolstered by fresh headlines suggesting a softening in the rhetoric surrounding the US-China trade conflict.

Gold remains offered below $3,300
Gold reversed Thursday’s rebound and slipped toward the $3,260 area per troy ounce at the end of the week in response to further improvement in the market sentiment, which was in turn underpinned by hopes of positive developments around the US-China trade crisis.

Ethereum: Accumulation addresses grab 1.11 million ETH as bullish momentum rises
Ethereum saw a 1% decline on Friday as sellers dominated exchange activity in the past 24 hours. Despite the recent selling, increased inflows into accumulation addresses and declining net taker volume show a gradual return of bullish momentum.

Week ahead: US GDP, inflation and jobs in focus amid tariff mess – BoJ meets
Barrage of US data to shed light on US economy as tariff war heats up. GDP, PCE inflation and nonfarm payrolls reports to headline the week. Bank of Japan to hold rates but may downgrade growth outlook. Eurozone and Australian CPI also on the agenda, Canadians go to the polls.

The Best brokers to trade EUR/USD
SPONSORED Discover the top brokers for trading EUR/USD in 2025. Our list features brokers with competitive spreads, fast execution, and powerful platforms. Whether you're a beginner or an expert, find the right partner to navigate the dynamic Forex market.