- Gold price is looking to sustain its business firmly above $1,980.00 as investors see no rate hike in May.
- The USD Index has shown some signs of recovery from 102.00, however, the downside is still favored.
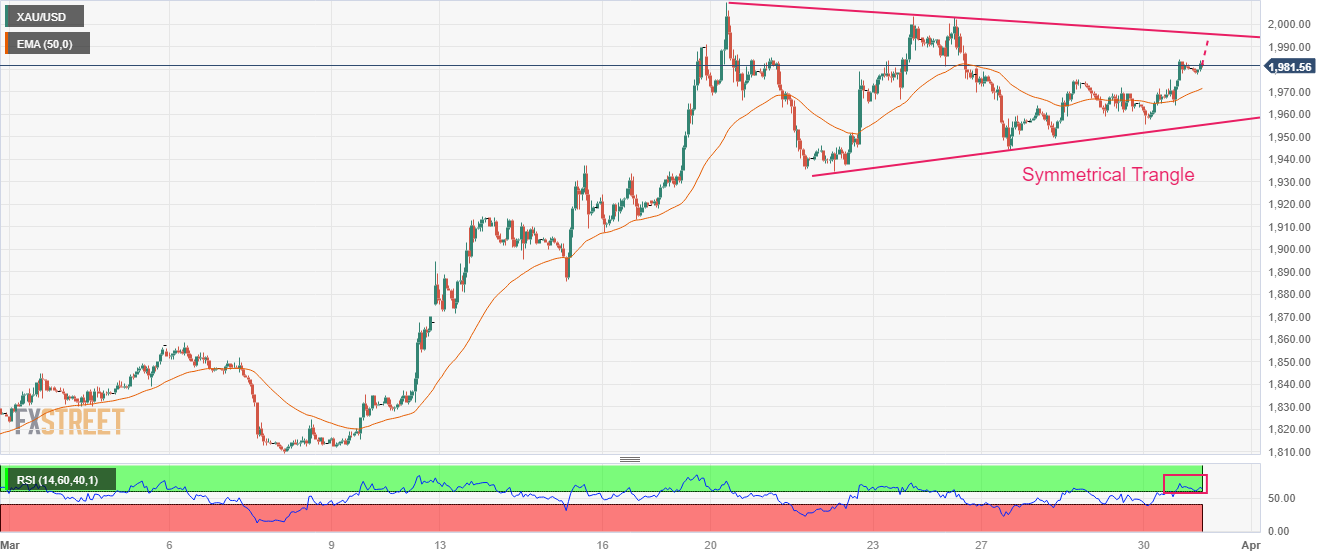
- Gold price is auctioning in a Symmetrical Triangle pattern, which is indicating volatility contraction ahead of the Fed’s preferred inflation tool.
Gold price (XAU/USD) is aiming to sustain its auction above the critical resistance of $1,980.00 in the Asian session. The precious metal is looking to surpass Thursday’s high of $1,984.65 despite the US Dollar Index (DXY) has shown some signs of recovery from 102.00.
S&P500 futures have generated significant gains in the Asian session. US equities have carry-forwarded the buying spree firmly, portraying a cheerful market mood. Meanwhile, the demand for US government bonds has been trimmed further in hopes of no further casualties in the United States banking sector.
The recovery move from the USD Index has to pass plenty of filters as investors are anticipating an unchanged monetary policy stance in May by the Federal Reserve (Fed). In a private meeting with US lawmakers, Fed chair Jerome Powell cited that he anticipates one more rate hike in 2023. The statement from Fed Powell is not restricted to the May policy. Therefore, the chances of a steady monetary policy in May are extremely solid.
On Friday, the USD Index will remain in action ahead of the release of the core Personal Consumption Expenditure (PCE) Price Index data. Analysts at Wells Fargo have forecasted the PCE deflator (+0.4%) to outpace nominal spending (+0.3%).
Gold technical analysis
Gold price is auctioning in a Symmetrical Triangle chart pattern on an hourly scale, which is indicating a sheer volatility contraction ahead of Fed’s preferred inflation tool. The upward-sloping trendline of the chart pattern is plotted from March 22 low at $1,934.34 while the downward-sloping trendline is placed from March 20 high at $2,009.88.
Broadly the Gold price is overlapping the 50-period Exponential Moving Average (EMA) at above $1,970.00, which indicates that the consolidation is still on.
The Relative Strength Index (RSI) (14) is oscillating in the bullish range of 60.00-80.00, which favors more upside ahead.
Gold hourly chart
Information on these pages contains forward-looking statements that involve risks and uncertainties. Markets and instruments profiled on this page are for informational purposes only and should not in any way come across as a recommendation to buy or sell in these assets. You should do your own thorough research before making any investment decisions. FXStreet does not in any way guarantee that this information is free from mistakes, errors, or material misstatements. It also does not guarantee that this information is of a timely nature. Investing in Open Markets involves a great deal of risk, including the loss of all or a portion of your investment, as well as emotional distress. All risks, losses and costs associated with investing, including total loss of principal, are your responsibility. The views and opinions expressed in this article are those of the authors and do not necessarily reflect the official policy or position of FXStreet nor its advertisers. The author will not be held responsible for information that is found at the end of links posted on this page.
If not otherwise explicitly mentioned in the body of the article, at the time of writing, the author has no position in any stock mentioned in this article and no business relationship with any company mentioned. The author has not received compensation for writing this article, other than from FXStreet.
FXStreet and the author do not provide personalized recommendations. The author makes no representations as to the accuracy, completeness, or suitability of this information. FXStreet and the author will not be liable for any errors, omissions or any losses, injuries or damages arising from this information and its display or use. Errors and omissions excepted.
The author and FXStreet are not registered investment advisors and nothing in this article is intended to be investment advice.
Recommended content
Editors’ Picks
AUD/USD remained bid above 0.6500
AUD/USD extended further its bullish performance, advancing for the fourth session in a row on Thursday, although a sustainable breakout of the key 200-day SMA at 0.6526 still remain elusive.
EUR/USD faces a minor resistance near at 1.0750
EUR/USD quickly left behind Wednesday’s small downtick and resumed its uptrend north of 1.0700 the figure, always on the back of the persistent sell-off in the US Dollar ahead of key PCE data on Friday.
Gold holds around $2,330 after dismal US data
Gold fell below $2,320 in the early American session as US yields shot higher after the data showed a significant increase in the US GDP price deflator in Q1. With safe-haven flows dominating the markets, however, XAU/USD reversed its direction and rose above $2,340.
Bitcoin price continues to get rejected from $65K resistance as SEC delays decision on spot BTC ETF options
Bitcoin (BTC) price has markets in disarray, provoking a broader market crash as it slumped to the $62,000 range on Thursday. Meanwhile, reverberations from spot BTC exchange-traded funds (ETFs) continue to influence the market.
US economy: slower growth with stronger inflation
The dollar strengthened, and stocks fell after statistical data from the US. The focus was on the preliminary estimate of GDP for the first quarter. Annualised quarterly growth came in at just 1.6%, down from the 2.5% and 3.4% previously forecast.