Gold Price Forecast: Will $1,859 cap the XAUUSD recovery? – Confluence Detector
- Gold Price rallies to one-week highs above $1,850 as US dollar wilts.
- Positive US Treasury yields cap the upside in XAUUSD amid cautious optimism.
- Acceptance above $1,859 is critical to unleashing further recovery.

Gold Price is kicking off a new week on the right footing, extending the previous week’s recovery momentum amid notable US dollar supply. The dollar keeps correcting lower, despite the cautious optimism, driving XAUUSD to fresh weekly highs above $1,850. Although the inverse relationship between Gold and the US Treasury yields is back in play and could cap the further upside. The Treasury yields are rallying on the hawkish Fed outlook while heading towards Wednesday’s FOMC Minutes. Growth and inflation fears continue to affect the market’s risk perception, eventually impacting the dollar and gold trades.
Also read: Gold, Chart of the Week: XAU/USD bulls take charge to challenge critical resistance
Gold Price: Key levels to watch
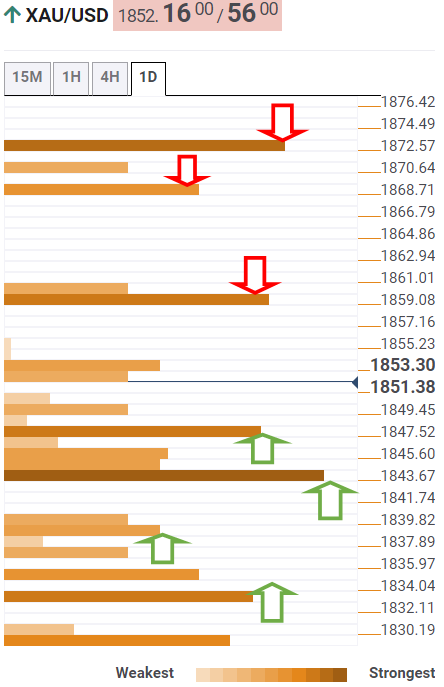
The Technical Confluences Detector shows that the Gold Price has stalled its recovery momentum, having run into a strong barrier at $1,859, which is the convergence of the Bollinger Band one-day Middle, pivot point one-day R2 and the previous high four-hour.
Acceptance above the latter will unleash the additional upside towards the pivot point one-week R1 at $1,870. The pivot point one-day R3 also aligns at that price level.
The previous month’s low of $1,872 will be the level to beat for XAU bulls should the renewed upside extend.
On the downside, strong support appears at the pivot point one-month S1 at $1,848, below which the $1,843 neighborhood will get tested.
That demand area is the confluence of the Fibonacci 38.2% one-day, SMA10 four-hour and the previous low four-hour.
The intersection of the Fibonacci 61.8% one-day and SMA200 one-day at $1,838 will come into play.
The last line of defense for gold bulls is seen around $1,834, where the Fibonacci 23.6% one-week coincides with the SMA10 one-day and the previous day’s low.
Here is how it looks on the tool
About Technical Confluences Detector
The TCD (Technical Confluences Detector) is a tool to locate and point out those price levels where there is a congestion of indicators, moving averages, Fibonacci levels, Pivot Points, etc. If you are a short-term trader, you will find entry points for counter-trend strategies and hunt a few points at a time. If you are a medium-to-long-term trader, this tool will allow you to know in advance the price levels where a medium-to-long-term trend may stop and rest, where to unwind positions, or where to increase your position size.
Author

Dhwani Mehta
FXStreet
Residing in Mumbai (India), Dhwani is a Senior Analyst and Manager of the Asian session at FXStreet. She has over 10 years of experience in analyzing and covering the global financial markets, with specialization in Forex and commodities markets.


