Gold Price Forecast: Down over 1.0% as banking crisis fears ease, double top forming
- Gold price pullback picks up pace after news First Citizens Bank has taken over SVB.
- US Treasury yields rise and reduced demand from India add downside pressure for Gold price.
- Gold remains in an uptrend but double bottom threatens with neckline at key $1,934.

XAU/USD trades in the $1,950s at the time of writing, down over 1.0% on the day, as easing bank stress has lessened Gold’s safe-haven appeal. Rising US Treasury bond yields, a robust US Dollar and reports of falling demand from India – one of Gold's chief markets – are further depressing prices.
News of Silicon Valley Bank takeover soothes markets
The news that First Citizens Bancshares Inc, the holding company of North-Carolina based First Citizens Bank, has bought defunct lender Silicon Valley Bank (SVB) has brought some temporary relief to markets on Monday, March 27, lessening demand for safe-haven Gold.
First Citizens has taken over all of SVB’s $119B deposits and loans, and has bought $72B of its assets, at a $16.5B discount, a press release from the FDIC said.
The deal limits the damage from SVB’s failure but does not eradicate it: the bank’s collapse is still thought to have cost the FDIC $20B.
Rise in yields a headwind
The reduction in global banking fears brought about by the SVB takeover has translated into a rise in US Treasury bond yields, which has supported the US Dollar (USD) – both are seen as negative headwinds for Gold price.
All across the US yield curve bonds of different maturities have gained. The benchmark 10-year US Treasury bond yield is rising 2.49% to 3.462 at the time of writing. The 5-year has seen the greatest rise, however, up 3.45% to 3.53 on the day. Higher yields suggest a greater opportunity cost for holding Gold, which yields nothing, making it a less attractive asset to investors.
The fact that US Treasury yields are rising suggests that the market now thinks the Fed will continue raising rates to combat inflation at the more aggressive pace it was raising them prior to the banking crisis.
As a counterweight to this view, however, the Fed Fund Futures curve is pricing in an alternative scenario of three interest rate cuts, by the Fed before the end of the year. This can be seen on the CME FedWatch Tool chart below, which uses Fed Funds Futures to assess the probabilities of the Fed making changes to its Fed Funds rate at future meetings.
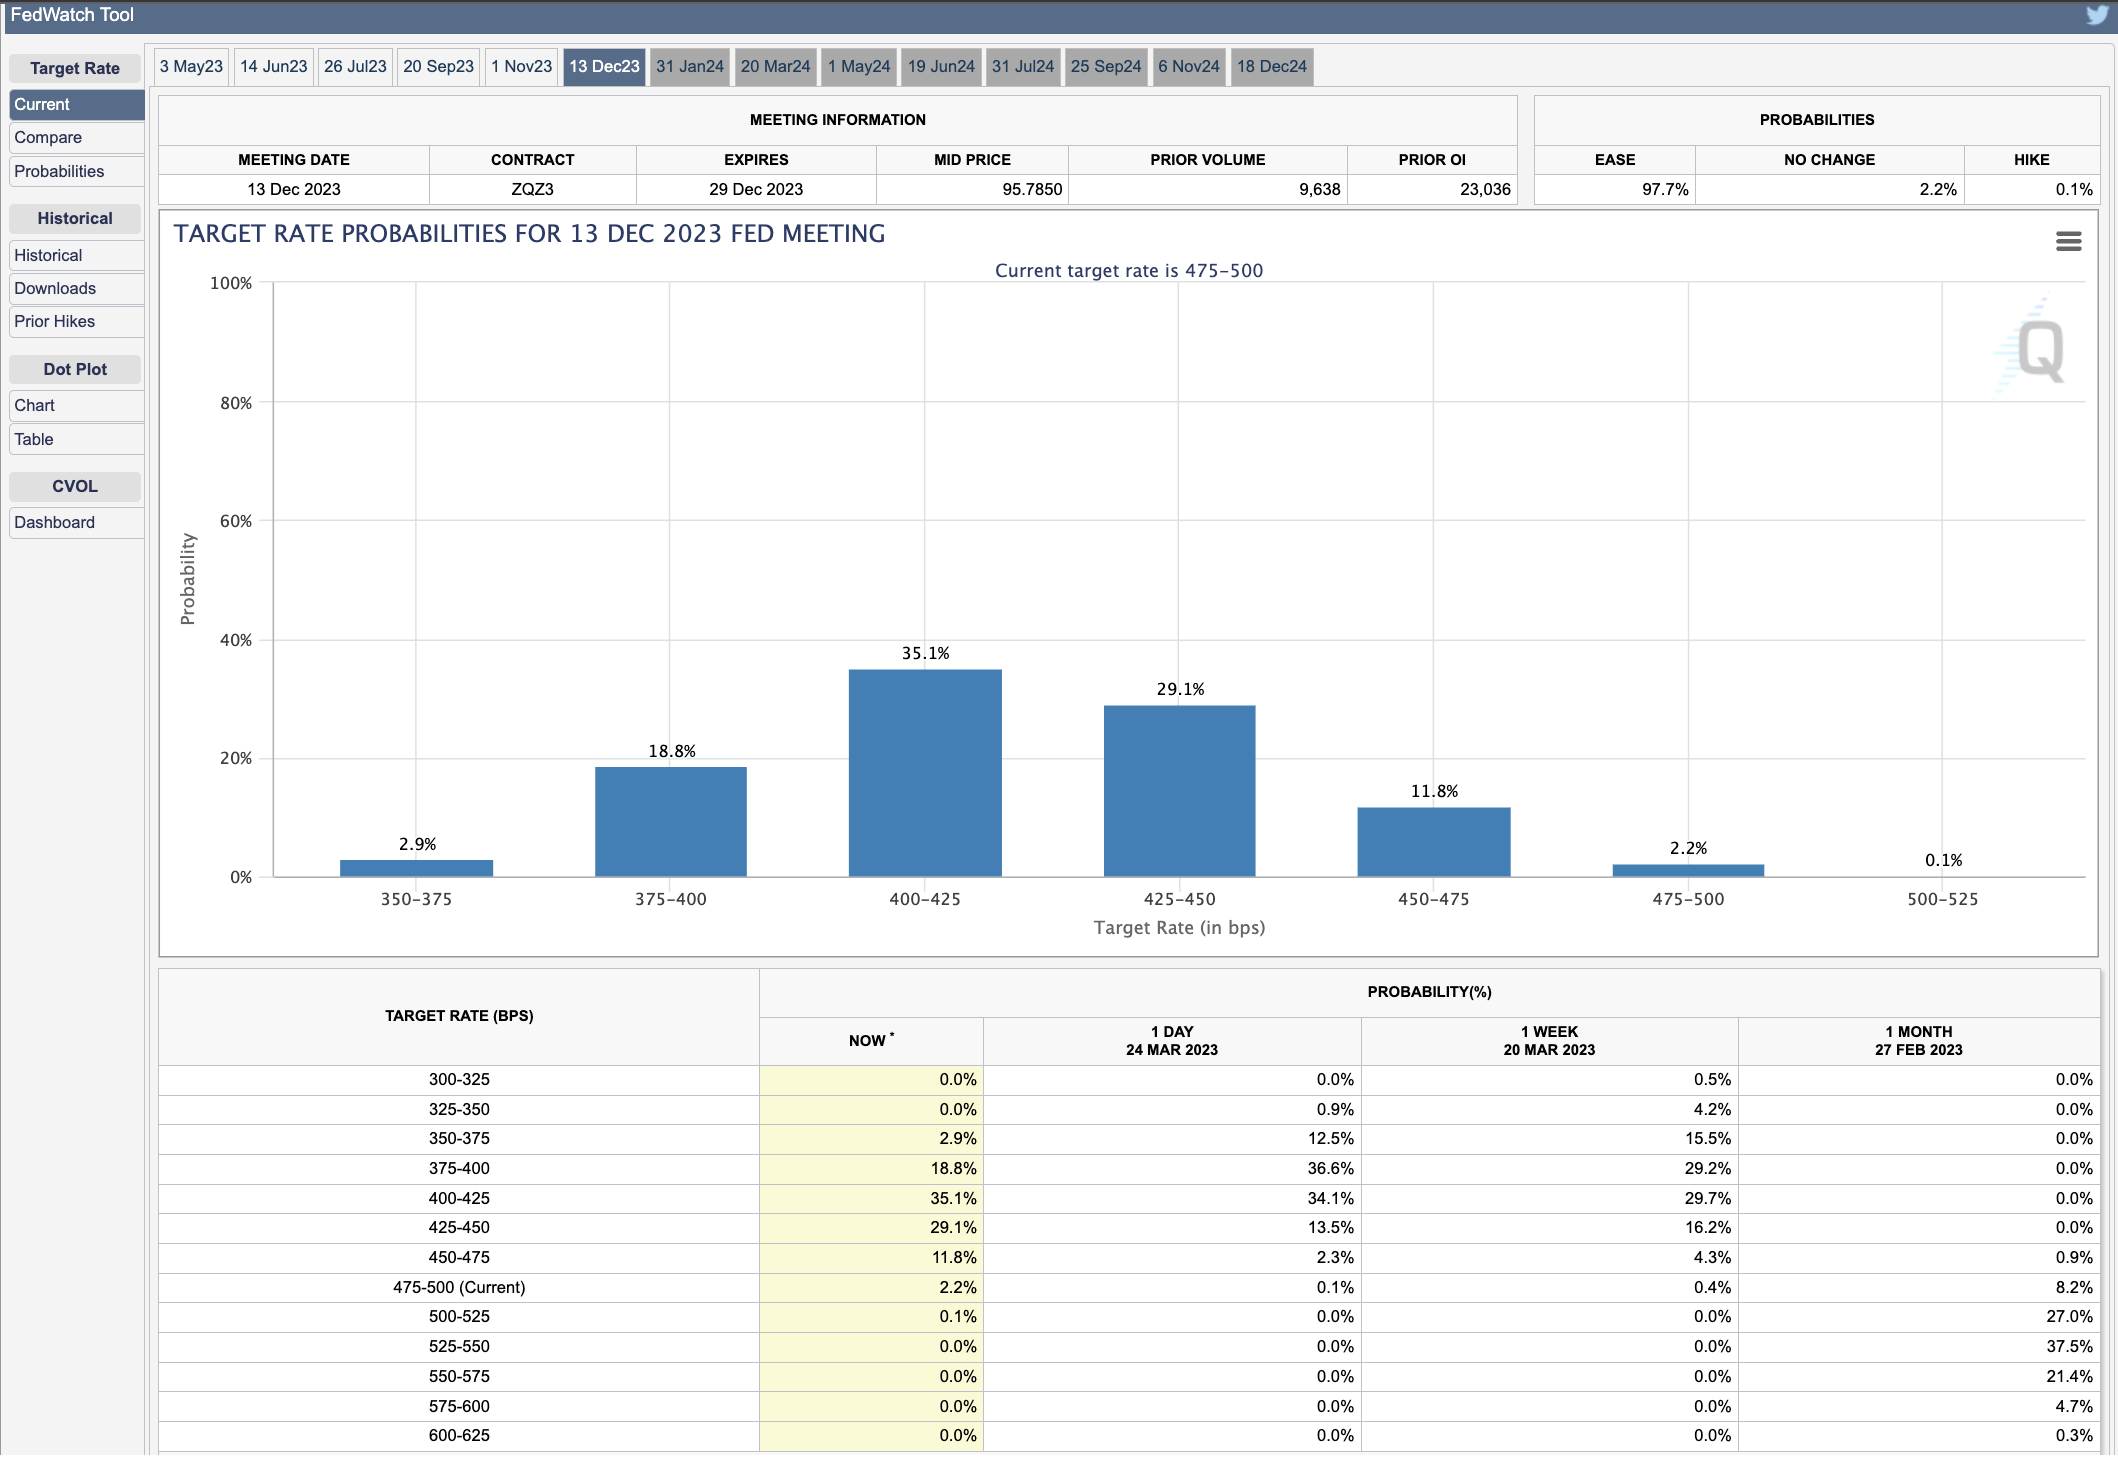
The chart shows the probabilities of what the future Fed Funds rate might be after the December 13 2023 meeting. The range with the current highest probability of 35.1% is between 4.00-4.25%, which suggests the Fed will cut rates by 0.75% from its current range of 4.75-5.00% before the end of the year – the equivalent to three 25 basis points cuts.
India stops buying Gold
Reports that demeand from buyers in India has fallen may have further weighed on prices. The spike in Gold prices because of of the banking crisis pushed price to a bitting point above which Indian Gold traders are not willing to pay.
"A rally in gold prices to an all-time high in India is deterring local buyers in the runup to what is normally a key demand period next month, according to the World Gold Council," said the Bloomberg report.
"If prices steady around current levels, demand may return for the key buying day of Akshaya Tritiya in April, but continued volatility will force people to stay away," said P.R. Somasundaram, regional Chief Executive officer for India at the London-based council, in the Bloomberg Television interview.
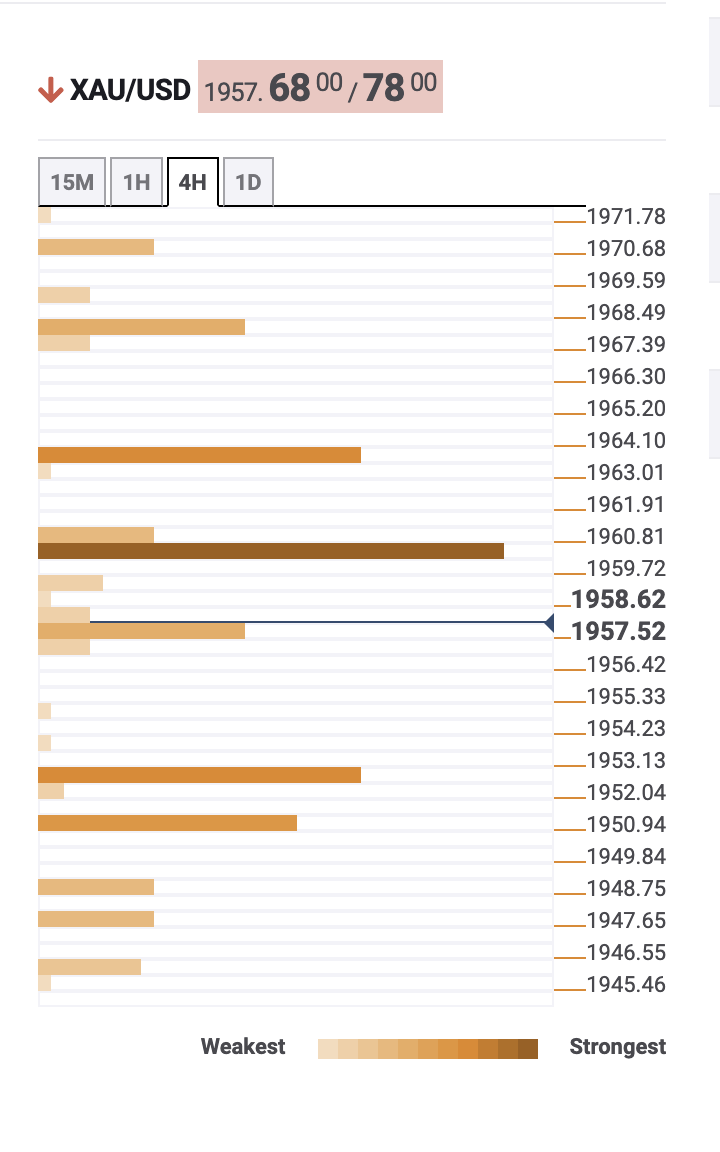
Gold price: Double top forms on 4-hour chart
Gold price may have formed a double top reversal pattern on the 4-hour chart which could indicate more downside to come if price decisively breaks below the neckline at the level of the key lower low at $1,934. In such a scenario the Gold price would be be expected to fall the same distance lower as the height of the pattern, or at least a 61.8% Fibonacci extension of the height. This suggests a downside target at about $1,870, close to where the 200-4hr Simple Moving Average (SMA) is located.
-638155214040963103.png)
Gold price: Daily Chart
The Relative Strength Index (RSI) is also diverging bearishly with price, which means that although price has not been able to form a lower low the RSI has. Such divergence often points to underlying weakenss in the price and may be a sign more losses are on the horizon.
The FXStreet Technical Confluence detector is showing a cluster of resistance just above the current price level at $1,960. This is likely to present a barrier for bulls trying to push Gold price higher.
Despite the formation of the bearish double top reversal pattern, more downside cannot be confirmed until the Gold price breaks below the neckline. In the event it fails to, the short to medium-term uptrend will remain intact. Given the old adage that "the trend is your friend until the bend at the end" the overall bias remains bullish and the uptrend may resume at any time, pushing the Gold price higher.
In the event of a break above the $2,009 March 20 highs, the next upside target for Gold price might be at the $2,070 March 2022 highs.
Author

Joaquin Monfort
FXStreet
Joaquin Monfort is a financial writer and analyst with over 10 years experience writing about financial markets and alt data. He holds a degree in Anthropology from London University and a Diploma in Technical analysis.


