Gold Price Forecast: XAU/USD consolidates the blistering rally above $1800
- Gold is testing a critical level of resistance at $1,805 and near $1,810 as the US dollar crumbles.
- The greenback has dropped back to test the 93 figure as risk appetite improves.

Update: Gold price is trading modestly flat above $1800 so far this Tuesday, consolidating Monday’s upsurge while holding close to the highest levels in two weeks reached at $1806. The blistering rally in gold price seen a day before could be mainly attributed to the broad-based US dollar weakness, as the Delta covid variant concerns poured cold water on the Fed’s tapering expectations ahead of the Jackson Hole Symposium. Further, escalating coronavirus concerns and its impact on the global economic recovery bolstered the safe-haven appeal of the yellow metal. Meanwhile, the downbeat US Markit PMIs also added to the economic growth concerns, collaborating with the upside in gold price.
Looking ahead, gold price action will remain at the mercy of the risk trends and the US dollar dynamics amid a light data docket this Tuesday.
Read: Will Jackson Hole become a dovish event?
The price of gold is flat in Asia, with the bulls comfortably sat above the psychological $1,800 figure following a glitch in the US dollar's flight plan.
At the time of writing, XAU/USD hovers between $1,805 and $1,806.02 while markets await the next catalyst to either make or break the bull's clutch.
Traders are waiting on Chair Powell's speech at Jackson Hole for the next cues on taper in what could be the makings of the next upsurge in the US dollar and a headwind for precious metals.
However, traders are now moving in droves into the dovish camp which has knocked the greenback of its throne.
On Wall Street, the dollar index DXY, which measures its performance against a basket of six currencies, fell from highly bullish territory to back below the 200-day simple moving average to test the bullish commitment near 93 the figure.
It was down some 0.57% to 92.95 towards the close on Wall Street. The index hit a nine-month high last week, climbing nearly 5% from May lows, as investors firmed up bets the Fed will start scaling back stimulus policies spurred by the pandemic ahead of some other central banks such as the ECB.
However, markets have concluded there's not going to be a "taper tantrum" like in 2013 following last week comments from Robert Kaplan, president of the Dallas Fed, who dented those expectations when he said he might reconsider the need for an early start to tapering if the virus harms the economy.
TD Securities sees ''little chance of an announcement and instead expects the Chair's speech to echo the latest July meeting minutes, suggesting that QE tapering is likely by year-end, but don’t expect a September announcement,'' their analysts wrote.
''This leaves November and December as likely timelines for the taper announcement. Notwithstanding, by revealed preference, our measure of asymmetry relative to real rates suggested that the pain trade in precious metals has likely run its course.''
Meanwhile, analysts at Brown Brothers Harriman explained that they think the September 21-22 FOMC meeting is a more likely venue to formally announce tapering.
''New macro forecasts will be released then. More importantly, the Fed will have gotten another jobs report on September 3 that will hopefully be strong enough to trigger tapering.'
However, it may not be the timings that are important, but the speed of which the Fed moves to lift off in terms of raising rates.
''It’s clear that once tapering starts, the Fed wants to get it over quickly, perhaps in the span of six months rather than twelve, the analysts at BBH expect.
''As such, our current call is for an explicit tapering announcement at the September FOMC, tapering of $20 bln in USTs and $10 bln in MBS at each meeting starting in November, and completion by March 2022.''
''If the economy continues to develop as the Fed expects, then this would allow for a waiting period of 6-9 months before rate lift-off in Q4 2022.'' the analysts concluded.
In such a scenario, the US dollar will remain atractove to investors for its yield advantage over currencies in other parts of the world, such as Europe, where the central bank is to remain behind the Fed.
Gold & DXY technical analysis
Meanwhile, the US dollar has taken a knock:
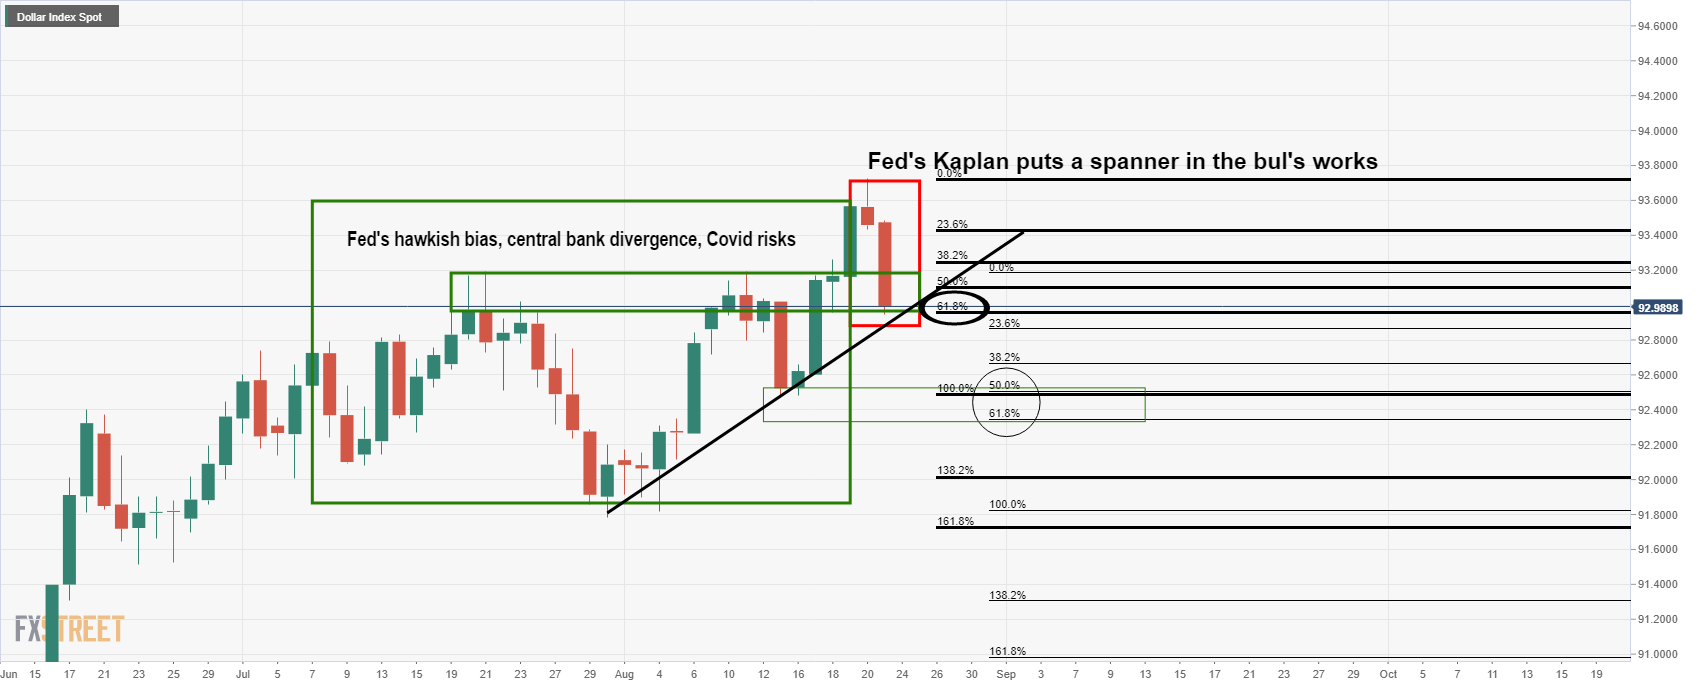
However, the price has run into a wall of support at a compelling 61.8% Fibo level that has a confluence with horizontal structure as well as a dynamic supporting trendline.
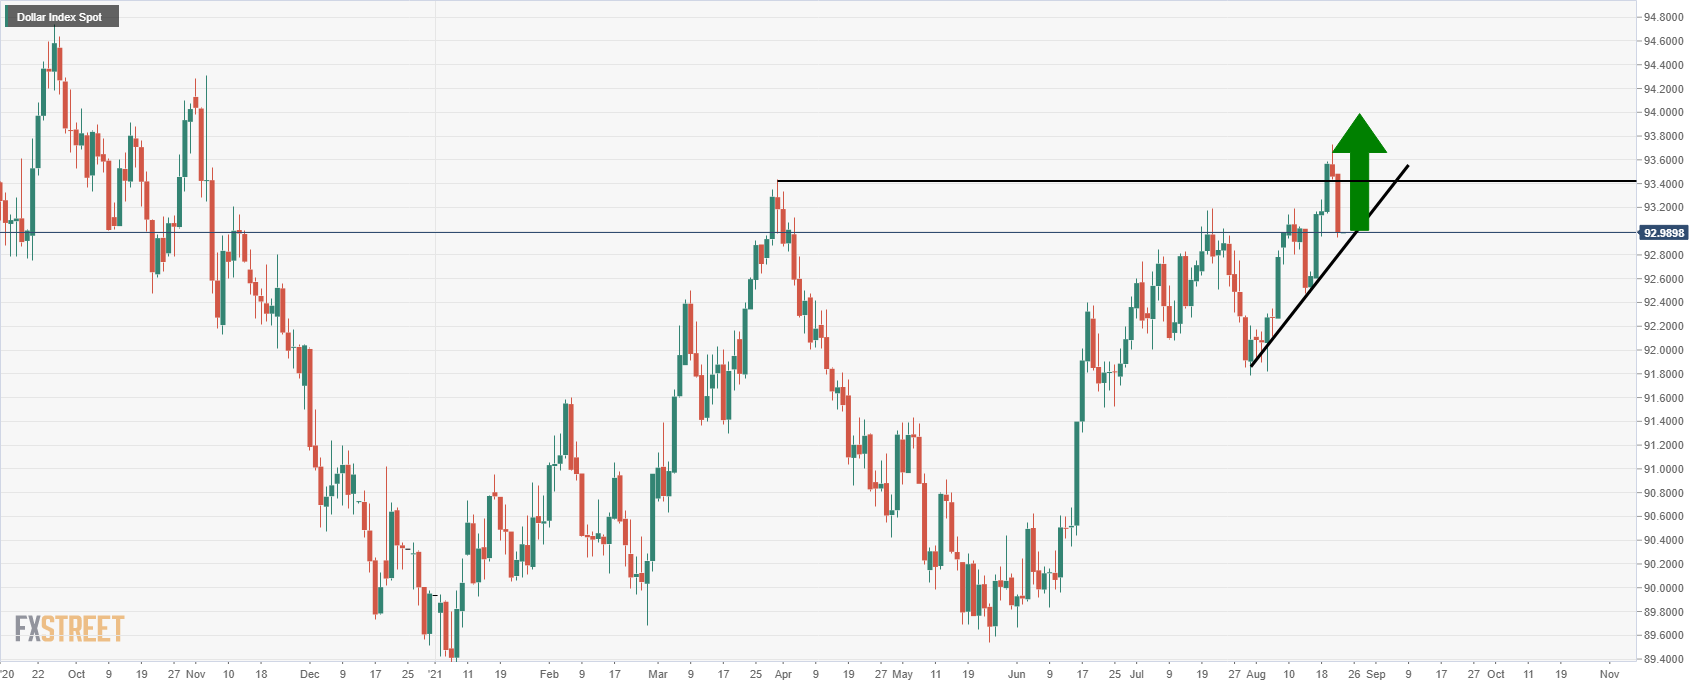
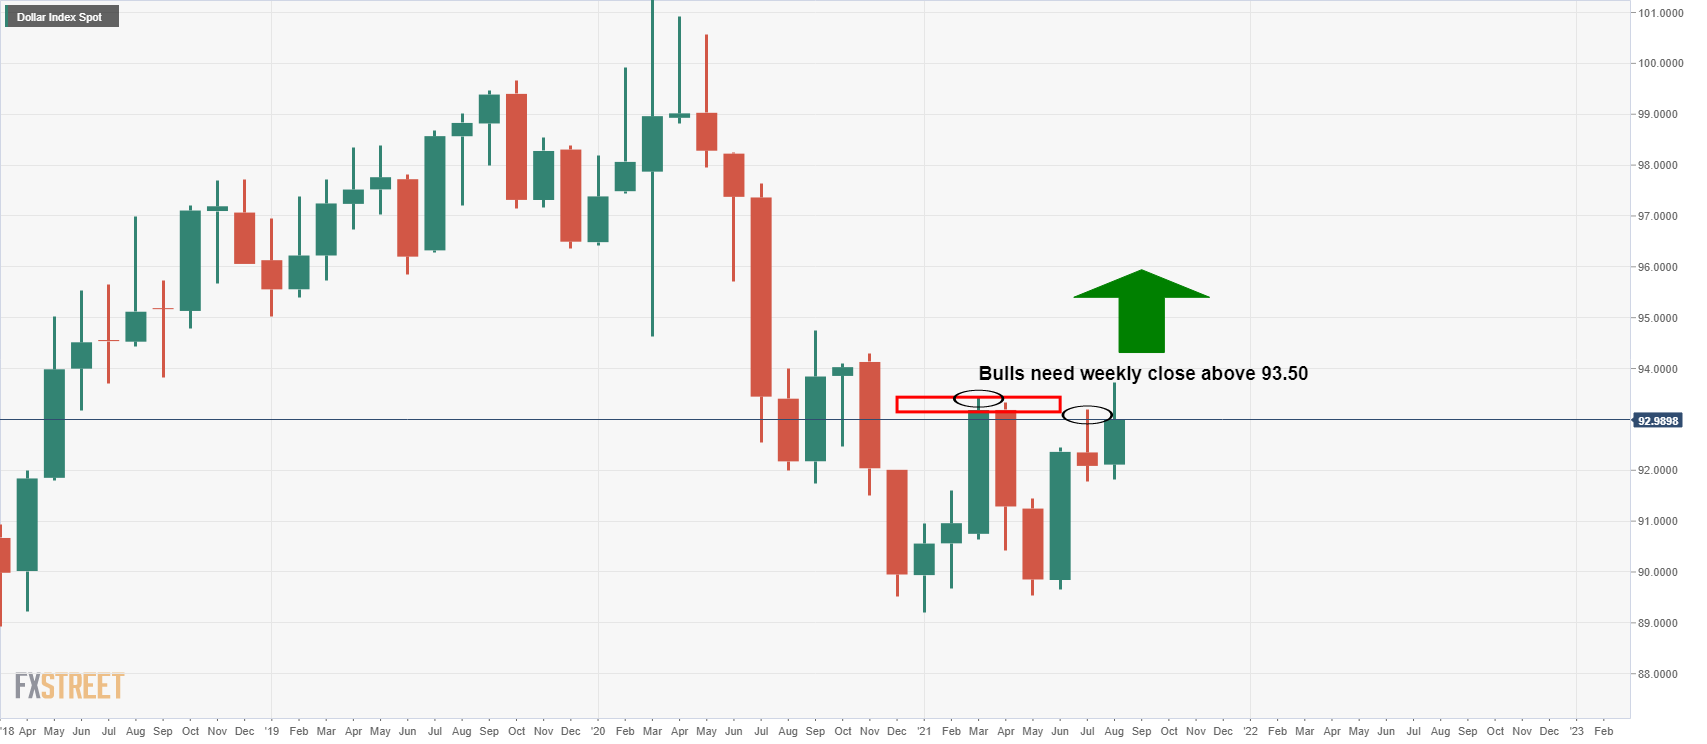
Therefore, if the bulls can hold on at this juncture, it will not take too much to see the US dollar regain its composure and head higher towards a weekly/monthly close above 93.50 as per the daily and monthly charts below:
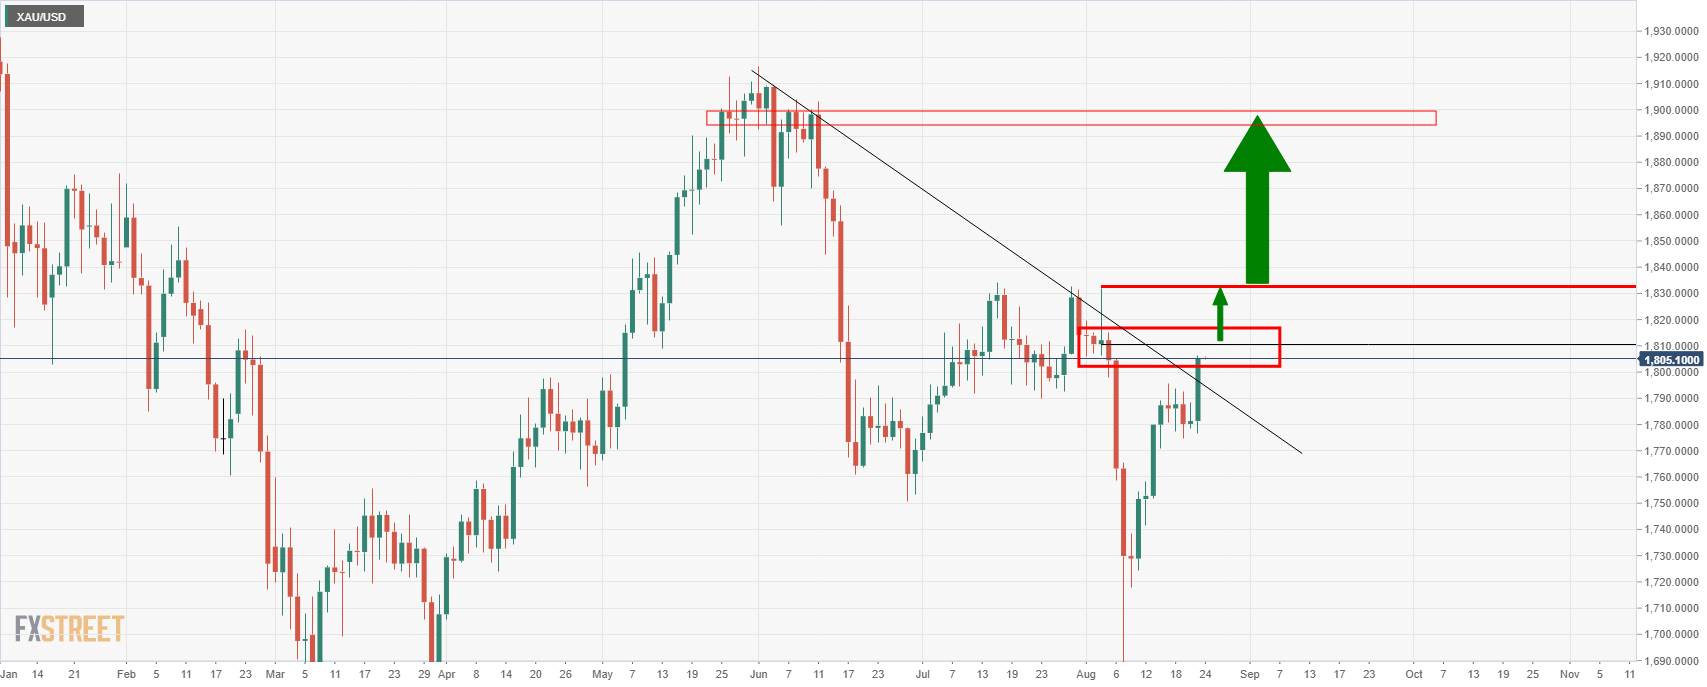
Meanwhile, 1,805 is a solid resistance on the weekly chart, (see last chart illustration below, (Weekly chart)).
On a daily basis, the gold price will need to break 1,810 before any conviction can be given to the rally:
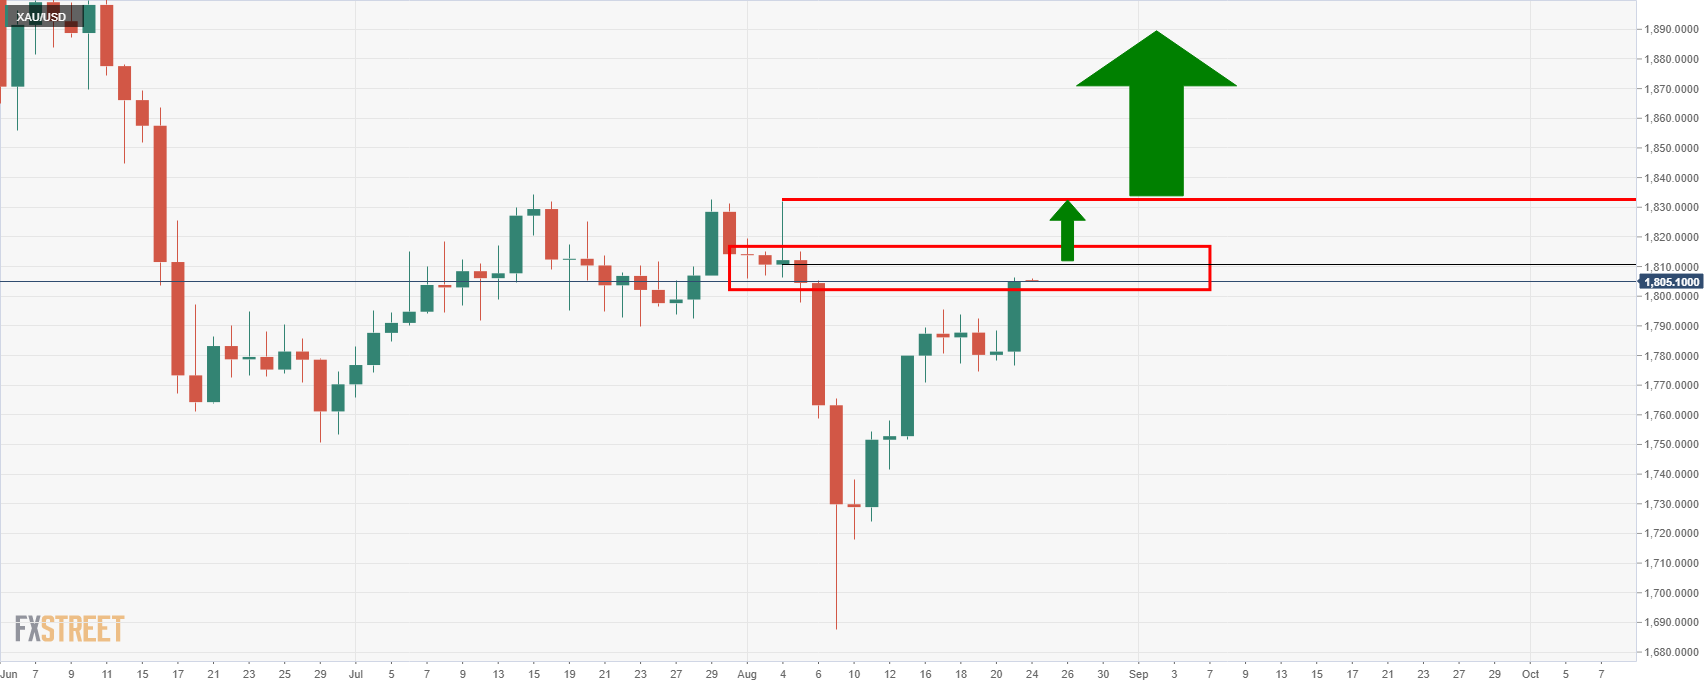
In doing so, it will likely close above both the dynamic trendline and horizontal resistance on a daily basis which would be the foundations for an upside continuation towards prior daily highs near 1,830 and then 1,900:
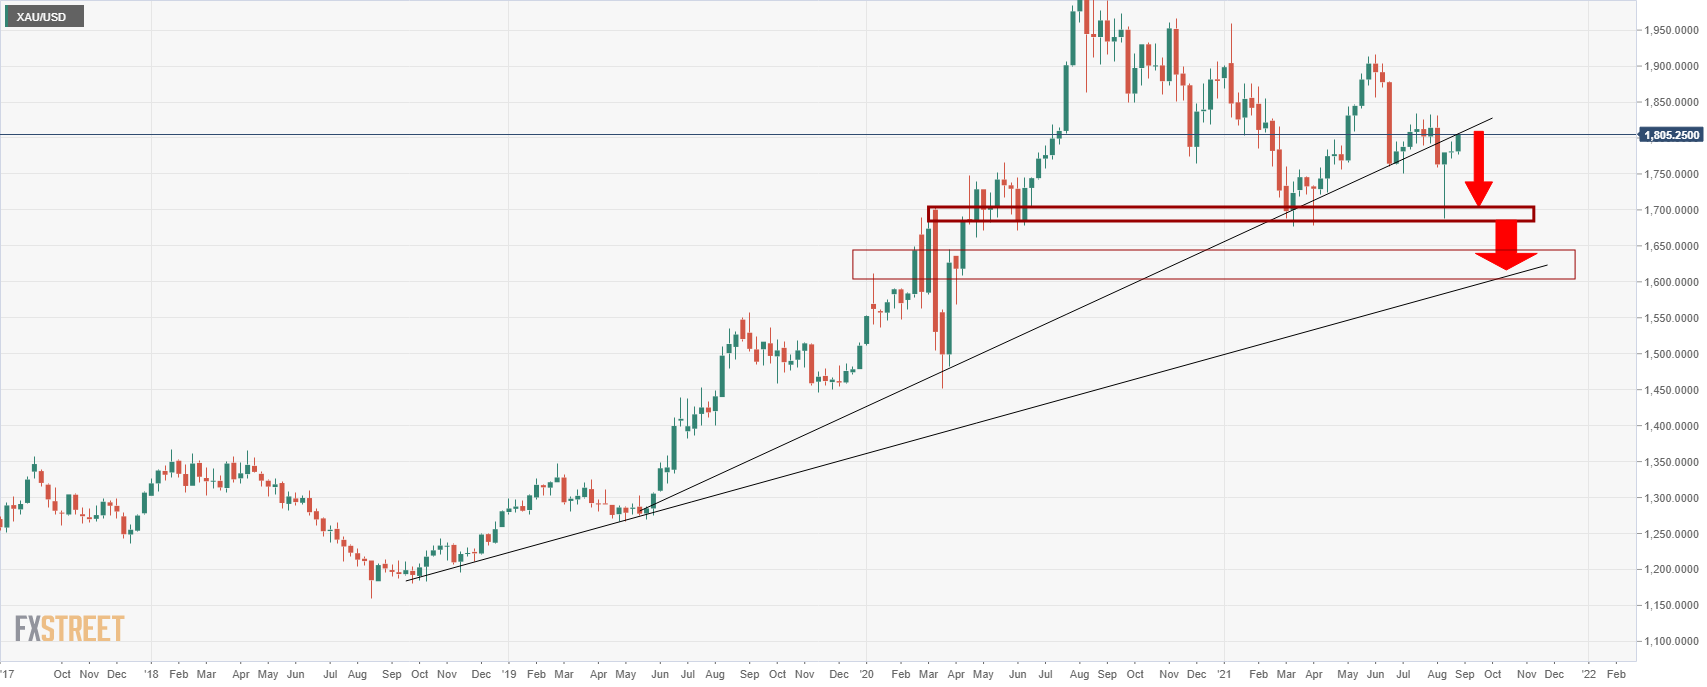
Weekly chart
On the other hand, should the US dollar resurge through 93.50, 93.80 will be on the bulls radar which will expose gold to a downside extension from the current weekly counter-trendline resistance:
Author

Ross J Burland
FXStreet
Ross J Burland, born in England, UK, is a sportsman at heart. He played Rugby and Judo for his county, Kent and the South East of England Rugby team.


