Gold Price Forecast: Battle lines well-mapped near $1,800, focus shifts to Fed minutes – Confluence Detector
- Gold price is looking to defend the key support yet again amid listless trading.
- Treasury yields, US dollar heal post-soft US CPI-led wounds ahead of Fed minutes.
- XAU/USD battle lines are well-defined near the $1,800 mark, where next?

Gold price is moving back and forth in a familiar range while trading close to the $1,800 mark, as the rebound in the US dollar and the Treasury yields keep bears in control. Markets don’t seem to be convinced that the Fed will alter its tightening cycle, in the face of the first signs of peak inflation, exerting downward pressure on the non-interest-bearing bullion. However, bulls continue to find comfort from growing recession fears amid renewed Chinese lockdown concerns and the deepening European gas crisis. Despite the listless trading over the past few days, XAU/USD remains on track to book the fourth weekly gain. Attention now turns towards the Fed July meeting’s minutes due for release next week for a fresh direction in the bright metal. In the meantime, the Fed rate hike expectations, growth fears and Fedspeak will continue to influence the metal price.
Also read: Gold Price Forecast: Losing bullish potential below $1,800
Gold Price: Key levels to watch
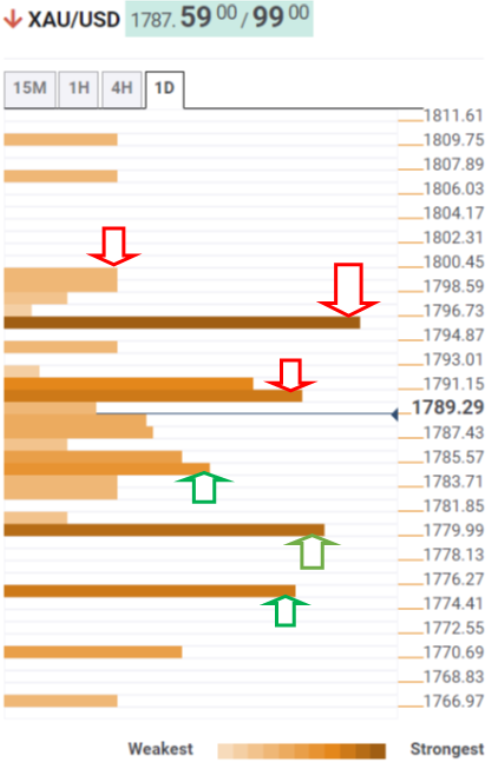
The Technical Confluence Detector shows that the gold price is defending the crucial support at $1,784, which is the convergence of the SMA50 one-day and the Fibonacci 23.6% one-week.
Should sellers find acceptance below the latter, the next downside cap at $1,780 will come into play. At that level, the Fibonacci 38.2% one-week and SMA10 one-day intersect.
The last line of defense for gold bulls is seen at the pivot point one-day S2 at $1,775.
Alternatively, sellers are aligned near $1,792 to guard the upside, the meeting point of the SMA10 four-hour and the Fibonacci 38.2% one-day.
Further up, the confluence of the previous week’s high and the pivot point one-week R1 at $1,796 will challenge the bearish commitments.
The $1,800 round figure and the monthly high of $1,808 will be next on buyers’ radars.
Here is how it looks on the tool
About Technical Confluences Detector
The TCD (Technical Confluences Detector) is a tool to locate and point out those price levels where there is a congestion of indicators, moving averages, Fibonacci levels, Pivot Points, etc. If you are a short-term trader, you will find entry points for counter-trend strategies and hunt a few points at a time. If you are a medium-to-long-term trader, this tool will allow you to know in advance the price levels where a medium-to-long-term trend may stop and rest, where to unwind positions, or where to increase your position size.
Author

Dhwani Mehta
FXStreet
Residing in Mumbai (India), Dhwani is a Senior Analyst and Manager of the Asian session at FXStreet. She has over 10 years of experience in analyzing and covering the global financial markets, with specialization in Forex and commodities markets.


