Gold Price Forecast: Battle lines well-mapped for XAU/USD ahead of key US inflation – Confluence Detector
- Gold price tests the higher levels once again amid steady USD, Treasury yields.
- Gold traders remain cautious of the critical US inflation data, Fed minutes.
- Gold on the back foot as NFP fails to alter taper prospects.

Gold price is posting modest gains but remains well within the recent trading range above the $1750 level so far this Tuesday. A flight to safety amid intensifying stagflation fears offers support to the traditional safe-haven gold. Further, a pause in the US Treasury yields rally aides the rebound in gold price. However, the Fed’s tapering expectations continue to limit gold’s upside potential, as investors await the return of full markets and Wednesday’s critical US inflation report for a fresh directional move in gold price.
Read: Gold Price Forecast: Will XAU/USD find a foothold above 21-DMA? US inflation in focus
Gold Price: Key levels to watch
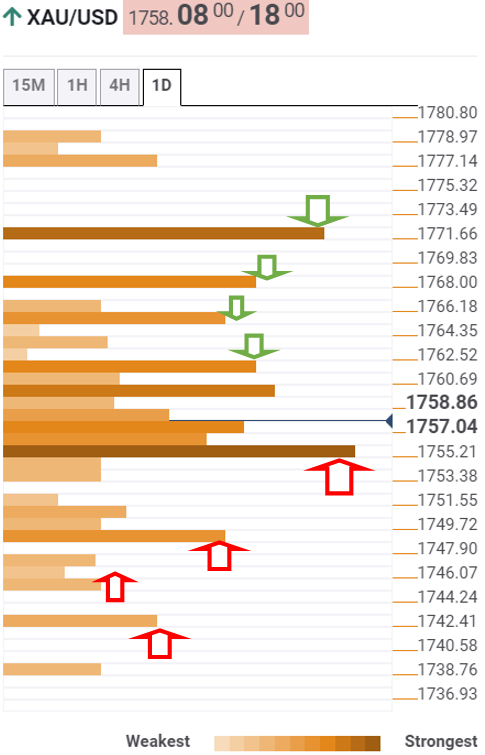
According to the Technical Confluences Detector, gold is moving back and forth, without a clear directional bias, with a bunch of healthy barriers stacked up in either direction.
Immediate upside is capped at $1762, which is the convergence of the Bollinger Band one-hour Upper and the previous day’s high.
The next significant topside hurdle is seen at $1765, where the Fibonacci 38.2% one-month aligns.
The Fibonacci 61.8% one-week at $1767 will then challenge the bearish commitments.
Gold bulls need to find acceptance above the pivot point one-day R3 at $1771 to initiate a meaningful uptrend.
Alternatively, gold buyers will once again challenge bids at $1755, the convergence of the Fibonacci 23.6% one-week and Fibonacci 38.2% one-day.
A sustained move below the latter will expose the $1750 psychological level, below which the next downside target at $1748 could get tested. That level is the Fibonacci 23.6% one-month.
The next cushion appears around $1745, where the previous week’s low intersects the pivot point one-day S2.
The pivot point one-week S1 at $1741 will be the level to beat for gold bears.
Here is how it looks on the tool
About Technical Confluences Detector
The TCD (Technical Confluences Detector) is a tool to locate and point out those price levels where there is a congestion of indicators, moving averages, Fibonacci levels, Pivot Points, etc. If you are a short-term trader, you will find entry points for counter-trend strategies and hunt a few points at a time. If you are a medium-to-long-term trader, this tool will allow you to know in advance the price levels where a medium-to-long-term trend may stop and rest, where to unwind positions, or where to increase your position size.
Author

Dhwani Mehta
FXStreet
Residing in Mumbai (India), Dhwani is a Senior Analyst and Manager of the Asian session at FXStreet. She has over 10 years of experience in analyzing and covering the global financial markets, with specialization in Forex and commodities markets.


