Gold Price Forecast: Will XAU/USD find a foothold above 21-DMA? US inflation in focus
- Gold price rebounds amid stabilizing Treasury yields, risk-off mood.
- US dollar holds near yearly highs, as all eyes shift towards Wednesday’s inflation.
- Gold price needs a daily closing above 21-DMA to negate the bearish bias.

After Friday’s wild swings, gold price ended Monday with modest losses, sticking to a tight range between $1761-$1750, as the US money markets remained closed due to the Columbus Day holiday. However, gold sellers returned amid resurgent safe-haven demand for the US dollar. Surging energy prices, with oil prices clinching seven-year highs, stoked up concerns over rising inflation and its risks on the global economic recovery. Further, gold price continued to suffer from the persistent expectations of the Fed’s tapering as early as November, with a probable rate hike in early 2022. The Fed sentiment combined with the US dollar price action dominated on Monday, as gold price kicked off the week on the wrong footing.
On Tuesday, gold price has staged a decent comeback, once again defending the $1750 support area, as the US Treasury yields pause their recent upsurge amid rising stagflation worries and China Evergrande fears. The US dollar has also somewhat eased, aiding gold’s upswing. However, with the Fed’s tapering bets alive and kicking, gold’s bullish potential is likely to remain limited. Further, gold traders will refrain from creating any fresh directional positions ahead of Wednesday’s critical US inflation data and the FOMC minutes. In the session ahead, the broader market sentiment, dynamics in the yields and energy prices will remain in focus for fresh trading impetus in gold price.
Gold Price Chart - Technical outlook
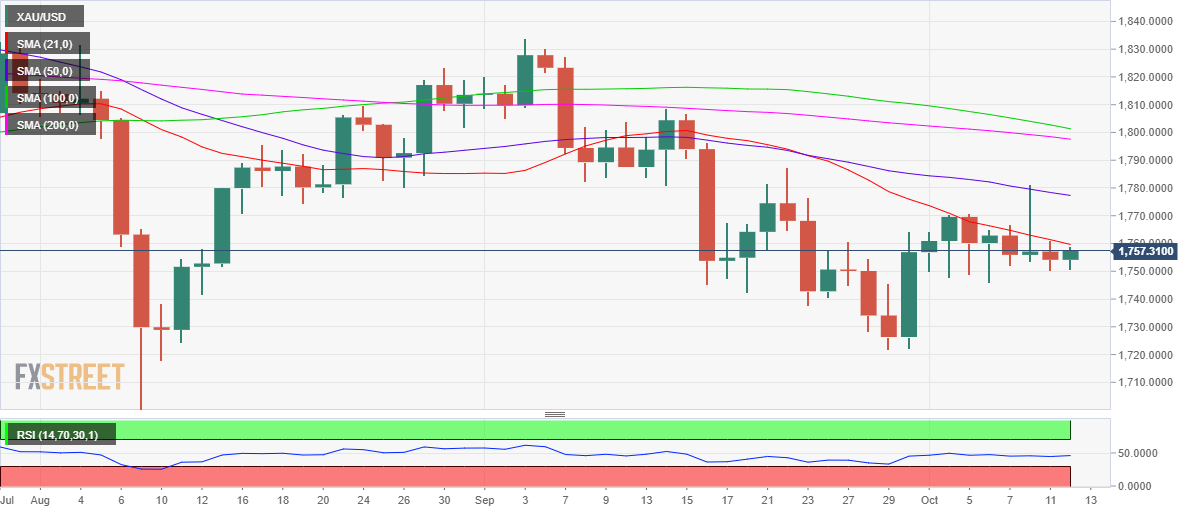
Gold: Daily chart
Gold’s daily chart shows that the price failed to find acceptance above the short-term critical resistance of the 21-Daily Moving Average (DMA), now at $1760, since mid-September.
Therefore, it is critical for gold bulls to yield a daily closing above the latter to negate the near-term bearish momentum.
The downward-sloping 50-DMA at $1777 will get tested on a sustained move above the latter. The $1800 round number will be next on the buyers’ radars. At the level, the 200-DMA aligns.
However, the 14-day Relative Strength Index (RSI) trades flatlined but below the midline, suggesting the downside bias remains intact for now.
On the downside, the $1750-$1745 demand area needs to be taken out convincingly to bring the multi-week troughs of $1722 back into play.
Author

Dhwani Mehta
FXStreet
Residing in Mumbai (India), Dhwani is a Senior Analyst and Manager of the Asian session at FXStreet. She has over 10 years of experience in analyzing and covering the global financial markets, with specialization in Forex and commodities markets.