Gold Price Forecast: XAU/USD supported at 4-hour structure, eyes on NFP
- Gold is looking to extend Wednesday’s rebound towards $1800.
- Month and quarter-end flows rescued gold price but for how long?
- All eyes remain on the US ISM Manufacturing PMI and NFP data.
- Gold Weekly Forecast: Sellers look to retain control following uninspiring rebound

Update: Gold is 0.2% higher in the US session as the price holds territory above the 10 and 20 EMAs meeting on the 4-hour time frame. There has a reluctance to commit from the bulls in the $1,780s as markets get set for the showdown of the month in the US Nonfarm Payrolls. The greenback depends on it. In the data, the headline its self will not necessarily be what matters, although payrolls probably surged again, with the pace up from the +559k in May. Meanwhile, wages are key to broad-based price inflation and any signs of acceleration should get the market’s attention.
Update: Gold built on the previous day's recovery move from the vicinity of the $1,750 level, or two-and-half-month lows and gained traction for the second consecutive session on Thursday. The momentum pushed the XAU/USD back closer to the $1,780 level during the early European session, though any meaningful upside still seems elusive amid the prevalent strong bullish sentiment surrounding the US dollar. A stronger greenback tends to undermine demand for dollar-denominated commodities, including gold.
The markets have been speculating that the Fed will tighten its monetary policy if price pressures continue to intensify. The market expectations were further cemented by the overnight hawkish comments from Dallas Fed President Robert Kaplan. In an interview with Bloomberg TV, Kaplan said that they are seeing a broadening of price pressures and would prefer to taper sooner than the end of the year. This, along with a stronger ADP report, continued acting as a tailwind for the greenback and might cap gains for gold.
In fact, the key USD index climbed to the highest level since April 8 and was further supported by a goodish pickup in the US Treasury bond yields. This could further collaborate to keep a lid on any meaningful upside for the non-yielding gold. Moreover, investors might also refrain from placing any aggressive bets, rather prefer to wait on the sidelines ahead of Friday's release of the closely watched US monthly jobs report – popularly known as NFP. This, in turn, warrants some caution for bullish traders.
Heading into the key event risk, traders on Thursday will take cues from the US economic docket – highlighting the release of ISM Manufacturing PMI later during the early North American session. Apart from this, the US bond yields, might influence the USD price dynamics and produce some short-term trading opportunities around gold.
Previous update: Gold price is building on Wednesday’s rebound from two-month lows of $1750, although the bulls seem to lack follow-through momentum, as the US dollar holds the higher ground. The risk-off sentiment remains at full steam amid growing concerns over the rapid spread of the Delta covid strain, especially in the Asia-pac region. Meanwhile, rising expectations that the Fed will resort to dialling back of the monetary stimulus, after the US ADP NFP numbers outpaced expectations in June, keep the sentiment buoyed around the greenback.
Gold’s next direction will depend on the US NFP jobs report due this Friday. In the meantime, gold traders eagerly await the US ISM Manufacturing PMI for fresh dollar trades.
Read: Gold prices pull back ahead of key US jobs data: What’s next? [Video]
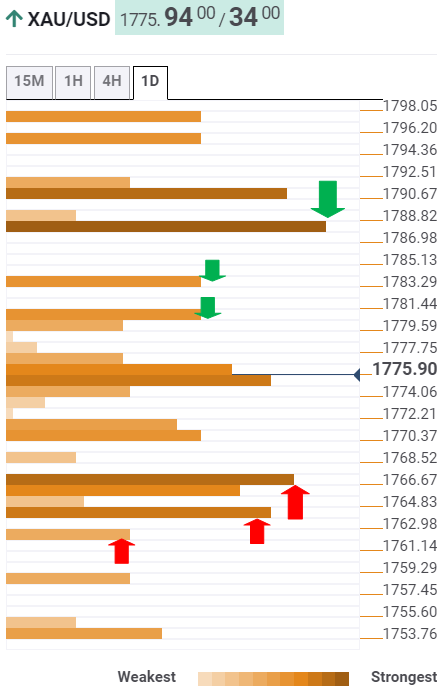
Gold Price: Key levels to watch
The Technical Confluences Detector shows that gold price is battling powerful resistance at $1775, which is the convergence of the SMA10 one-day, Fibonacci 61.8% one-week and the previous day’s high.
The next upside barrier is seen at the pivot point one-day R1 at $1778. Further up, the bulls will look to the Fibonacci 38.2% one-week at $1884.
The confluence of the Fibonacci 23.6% one-week and pivot point one-day R2 at $1787 will be a tough nut to crack for gold optimists.
On the flip side, the immediate cushion is aligned at $1770, the intersection of the Fibonacci 23.6% one-day and the previous high on four-hour.
Strong support emerges around $1765, the meeting point of the pivot point one-week S1 and Fibonacci 38.2% one-day.
The previous week’s low of $1761 could be next on the sellers’ radars. At that point, the Fibonacci 61.8% one-day collides.
Here is how it looks on the tool
About Technical Confluences Detector
The TCD (Technical Confluences Detector) is a tool to locate and point out those price levels where there is a congestion of indicators, moving averages, Fibonacci levels, Pivot Points, etc. If you are a short-term trader, you will find entry points for counter-trend strategies and hunt a few points at a time. If you are a medium-to-long-term trader, this tool will allow you to know in advance the price levels where a medium-to-long-term trend may stop and rest, where to unwind positions, or where to increase your position size.
Author

Dhwani Mehta
FXStreet
Residing in Mumbai (India), Dhwani is a Senior Analyst and Manager of the Asian session at FXStreet. She has over 10 years of experience in analyzing and covering the global financial markets, with specialization in Forex and commodities markets.


