Gold Price Analysis: XAU/USD’s path of least resistance appears down – Confluence Detector

Gold (XAU/USD) has turned south once again after facing rejection under $1850, although holds well above the multi-day lows of $1830. Gold draws support from the progress on US President Joe Biden’s $1.9 trillion stimulus package, which weighs on the safe-haven US dollar.
Meanwhile, surging demand for bullion coins also underpins the sentiment around the yellow metal. The US Mint said Tuesday, sales of gold bullion coins rose 258% in 2020 while silver coin demand was up 28%.
However, should the US ADP and ISM Services PMI better expectations, the greenback could resume the bullish momentum on the relative strength of the US economic recovery. How is gold positioned on the technical charts?
Gold Price Chart: Key resistances and supports
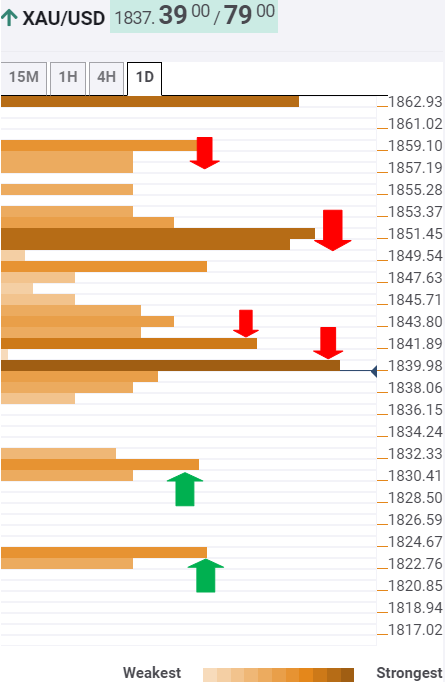
The Technical Confluences Indicator shows that gold has breached powerful support at $1840, where the SMA10 one-hour and Fibonacci 23.6% one-month converge.
Sellers now aim for significant support seen at $1831, which is the intersection of the previous week low and Bollinger Band four-hour Lower.
The next downside target for the XAU bears is aligned at the pivot point one-week S1 at $1823.
To the upside, acceptance above the critical support now resistance at $1840 could call for a test of the immediate hurdle placed at $1842, which is the confluence of the Fibonacci 23.6% one-week, SMA5 one-hour and Bollinger Band 15-minutes Middle.
Up next, a dense cluster of resistance levels around $1845/46 needs to be scaled in order to recapture the $1850 key cap. At that level, the SMA100 four-hour, Fibonacci 61.8% one-day and SMA50 four-hour meet.
Further north, the Fibonacci 61.8% one-week at $1858 is the level to beat for the bulls.
Here is how it looks on the tool
About Confluence Detector
The TCI (Technical Confluences Indicator) is a tool to locate and point out those price levels where there is a congestion of indicators, moving averages, Fibonacci levels, Pivot Points, etc. Knowing where these congestion points are located is very useful for the trader, and can be used as a basis for different strategies.
Author

Dhwani Mehta
FXStreet
Residing in Mumbai (India), Dhwani is a Senior Analyst and Manager of the Asian session at FXStreet. She has over 10 years of experience in analyzing and covering the global financial markets, with specialization in Forex and commodities markets.


