|

Gold Price Analysis: XAU/USD trying to hit the brakes, down into $1,824 for Tuesday

  • Gold on pace to close in the red for the seventh consecutive day.
  • XAU/USD has closed lower for ten of the last eleven daily trading sessions.
  • Gold prices are down nearly 6.5% from the last swing high into $1,947.55.

Gold prices are softly down on Tuesday as broader markets continue to radiate risk-off energy, trading into $1,823.30 as risk aversion remains the key theme for markets heading into the mid-week.

The XAU/USD is trading into seven-month lows, and a break lower south of $1,804.76 will see Gold trading into its lowest prices in nearly a year, and will set new lows for 2023.

Broad-market risk appetite has evaporated in recent days, sparked by rising concerns of the odds of a global recession, and investors have been flocking into the safe haven US Dollar (USD) as market headwinds continue to rise.

US Treasury yields have been climbing as the US government narrowly averted a shutdown on partisan brinkmanship, but the temporary stopgap measure only funds the US government through mid-November. Investors are unlikely to have much confidence stoked by the 45-day reprieve, and markets can expect to be forced back into another tension spiral by November 17th if the US can't square away a functioning budget.

Gold Futures: Further losses on the cards

Gold price struggles to capitalize on modest intraday recovery from multi-month low

XAU/USD technical outlook

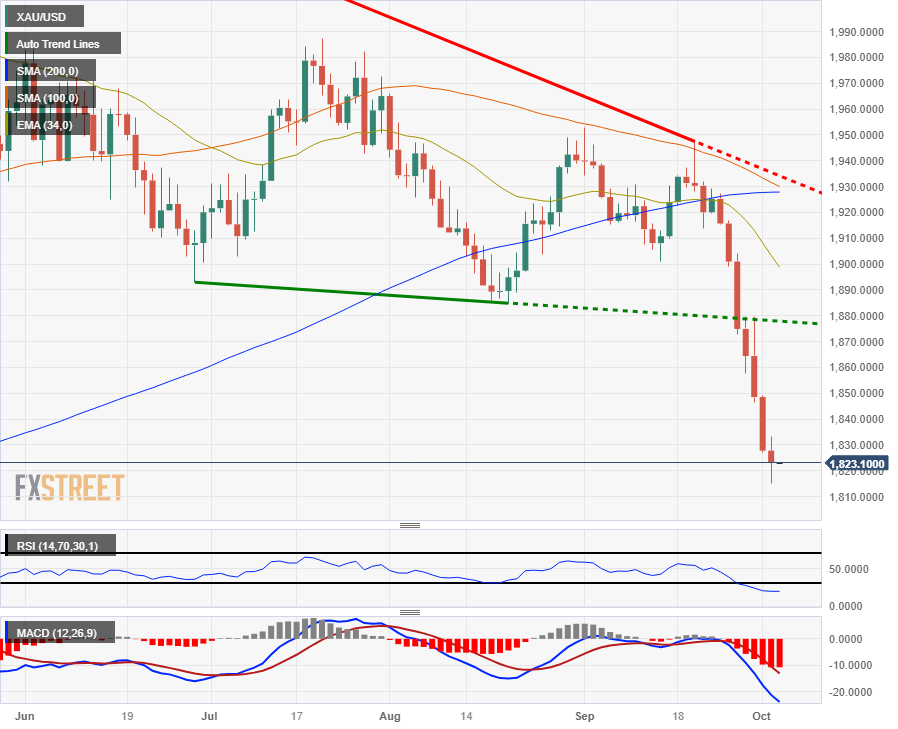
Gold prices are down over 5% in under a week and a half, sliding from $1,926 and extending the precious metal's decline from 2023's peak near $2,075.

Daily candlesticks see the XAU/USD tumbling well away from technical indicators, with the 200-day Simple Moving Average (SMA) well above current price action near $1,930 and technical indicators breaking in oversold territory.

The Relative Strength Index (RSI) is at its lowest value of 19.58 since 2015, and a break into $1,800 will see Gold prices turn red for the year.

XAU/USD daily chart

XAU/USD technical levels

XAU/USD

Overview
Today last price1823.24
Today Daily Change-4.57
Today Daily Change %-0.25
Today daily open1827.81
 
Trends
Daily SMA201906.68
Daily SMA501918.75
Daily SMA1001933.31
Daily SMA2001927.73
 
Levels
Previous Daily High1849.16
Previous Daily Low1827.23
Previous Weekly High1927.27
Previous Weekly Low1846.37
Previous Monthly High1953.01
Previous Monthly Low1846.37
Daily Fibonacci 38.2%1835.61
Daily Fibonacci 61.8%1840.78
Daily Pivot Point S11820.31
Daily Pivot Point S21812.8
Daily Pivot Point S31798.38
Daily Pivot Point R11842.24
Daily Pivot Point R21856.66
Daily Pivot Point R31864.17

Author

Joshua Gibson

Joshua joins the FXStreet team as an Economics and Finance double major from Vancouver Island University with twelve years' experience as an independent trader focusing on technical analysis.

More from Joshua Gibson
Share:

Editor's Picks

AUD/USD eyes 0.7150 barrier nine-day EMA

AUD/USD inches higher after registering modest losses in the previous day, trading around 0.7130 during the Asian hours. The technical analysis of the daily chart indicates that the pair is moving sideways within the rectangle pattern, suggesting a consolidation as neither the bulls nor the bears have enough momentum to take control of the market.

USD/JPY trades below 160.00 intervention threshold; bullish bias intact

The USD/JPY pair attracts some sellers during the Asian session amid fears that authorities will step in again to prop up the Japanese Yen. Furthermore, the Israel-Lebanon truce prompts some profit-taking around the US Dollar and exerts downward pressure on the currency pair.

Gold extends rebound to $4,500 as US yields edge lower

Gold (XAU/USD) preserves its recovery momentum following Wednesday's slide and tests the $4,500 mark in the second half of the day on Thursday. While US-Iran uncertainty remains, easing tensions between Lebanon on Israel seems to be helping the market mood improve, causing the USD to lose strength alongside falling US T-bond yields and opening the door for a decisive rebound in XAU/USD.

Hyperliquid: ETF demand, capital rotation fuel HYPE rally as Bitcoin melts

Hyperliquid price sustains an upward trend near its all-time high of $75.76 on Thursday after posting 80% gains in May, while Bitcoin (BTC) retraces below $65,000, triggering a market-wide panic.

Nonfarm payrolls: Testing the limits of Fed policy patience

The upcoming nonfarm payrolls report for May will provide the final update on the US labor market before Kevin Warsh attends his first policy meeting as the new Fed Chair later this month.

Recession on paper: What really moves the Canadian Loonie now?

Statistics Canada handed the headline writers a gift and the analysts a headache. Real GDP shrank 0.1% on an annualized basis in the first quarter, and with the fourth quarter of 2025 revised down to a 1.0% contraction, that is two negative quarters in a row, the textbook definition of a technical recession and Canada's first since the pandemic.