Gold Price Analysis: XAU/USD stages a quick comeback, still below $1850
- XAU/USD confirms symmetrical triangle breakout on the 4H chart.
- Acceptance above 100-SMA is critical to unleashing further upside.
- 200-SMA at $1863 is the next upside target amid bullish RSI.

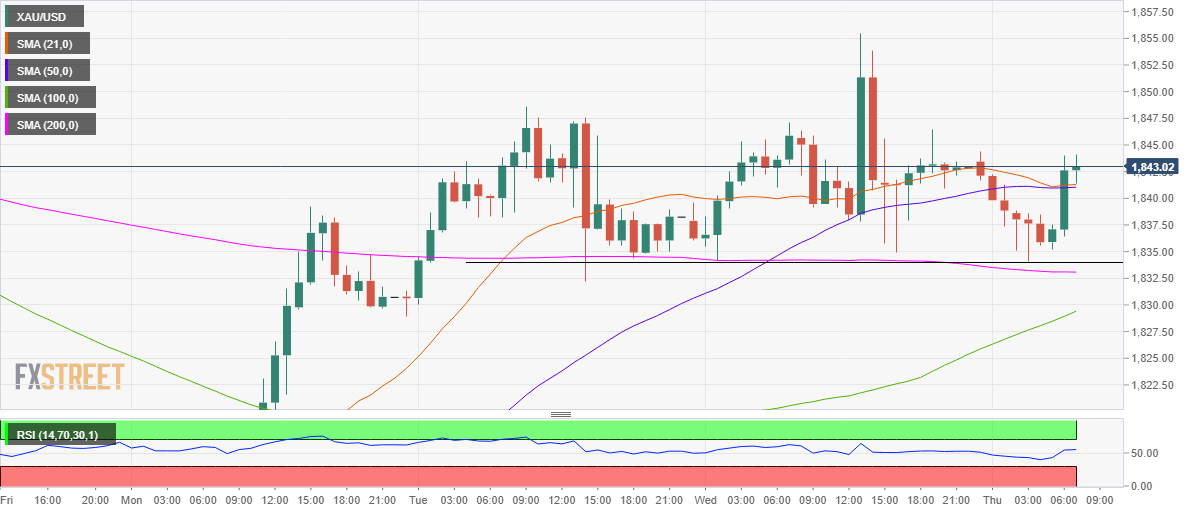
Gold (XAU/USD) has staged a quick comeback after meeting buyers once again around the $1833 region.
The level is the powerful confluence of the horizontal trendline support and the 200-hourly moving average (HMA).
Therefore, the bulls remain hopeful so long as that level is defended. In case of a failure to do so, the next relevant support is seen at the bullish 100-HMA of $1829.
A sharp sell-off cannot be ruled towards $1800 if the selling pressure intensifies.
While to the upside, the XAU bulls have recaptured the critical hurdle at $1841, which is the convergence of the horizontal 21 and 50-HMAs.
The buyers now aim for the $1850 psychological level once again, above which the multi-day tops of $1856 could be put to test.
The Relative Strength Index (RSI) has turned flat but sustains above the midline, allowing room for additional recovery.
Gold Price Chart: Hourly chart
Gold Additional levels
Author

Dhwani Mehta
FXStreet
Residing in Mumbai (India), Dhwani is a Senior Analyst and Manager of the Asian session at FXStreet. She has over 10 years of experience in analyzing and covering the global financial markets, with specialization in Forex and commodities markets.


