|

Gold Price Analysis: XAU/USD slides below triangle support, turns vulnerable ahead of FOMC

  • Gold witnessed some follow-through selling for the second consecutive session.
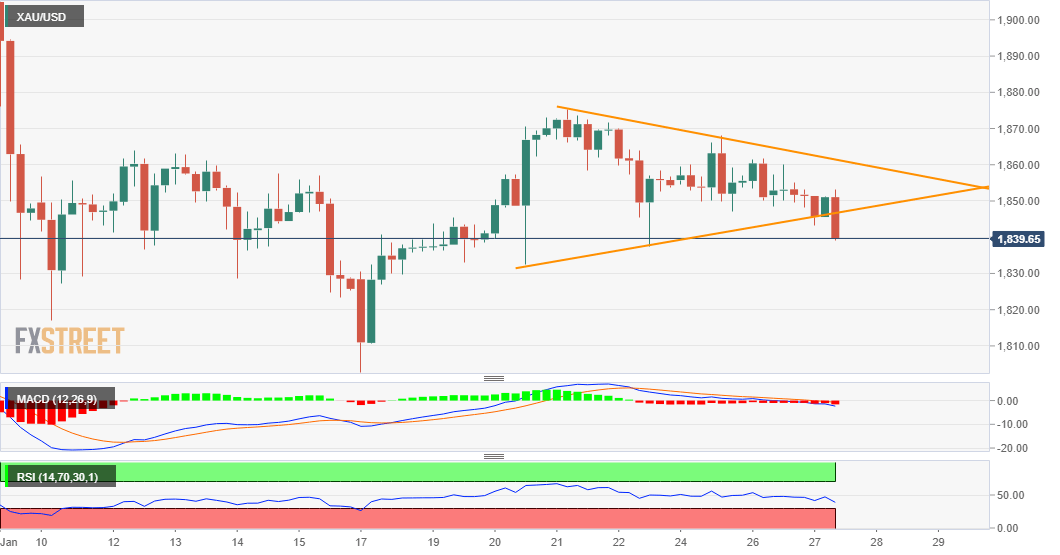
  • Break below a symmetrical triangle might have set the stage for further weakness.
  • A sharp fall in the global equity markets could help limit losses ahead of the FOMC.

Gold remained depressed through the mid-European session and dropped to fresh weekly lows, around the $1842-41 region in the last hour. Bearish traders are now looking to drag the commodity further below a one-week-old ascending trend-line, which constituted the formation of a symmetrical triangle.

Given the recent sharp pullback from monthly tops, around the $1960 region touched on January 6, the triangle could be categorised as a bearish continuation pattern – pennant. This, in turn, favours bearish traders and supports prospects for the resumption of a one-month-old downward trajectory.

Meanwhile, technical indicators on hourly charts have been gaining negative traction and have just started drifting into the bearish territory on the daily chart. This further adds credence to the negative outlook and a possible slide back towards challenging the $1800 round-figure mark.

In the meantime, intermediate support levels are pegged near the $1835 region ahead of the $1827 level and $1820-18 area. A sharp pullback in the equity markets could extend some support to the safe-haven XAU/USD and help limit deeper losses as the focus remains on the FOMC monetary policy decision.

On the flip side, the $1851-52 horizontal zone now seems to act as immediate resistance. Any subsequent move beyond the mentioned hurdle might still be seen as a selling opportunity and runs the risk of fizzling out rather quickly near the triangle resistance, around the $1860-62 region.

XAU/USD 4-hourly chart

fxsoriginal

Technical levels to watch

XAU/USD

Overview
Today last price1840.87
Today Daily Change-10.49
Today Daily Change %-0.57
Today daily open1851.36
 
Trends
Daily SMA201873.34
Daily SMA501858.08
Daily SMA1001881.2
Daily SMA2001849.34
 
Levels
Previous Daily High1861.8
Previous Daily Low1848.46
Previous Weekly High1875.2
Previous Weekly Low1802.8
Previous Monthly High1906.87
Previous Monthly Low1775.52
Daily Fibonacci 38.2%1853.56
Daily Fibonacci 61.8%1856.7
Daily Pivot Point S11845.95
Daily Pivot Point S21840.53
Daily Pivot Point S31832.61
Daily Pivot Point R11859.29
Daily Pivot Point R21867.21
Daily Pivot Point R31872.63

Author

Haresh Menghani

Haresh Menghani is a detail-oriented professional with 10+ years of extensive experience in analysing the global financial markets.

More from Haresh Menghani
Share:

Editor's Picks

EUR/USD: Breakdown below trading range support near 1.1770 comes into play

The EUR/USD pair opens with a bearish gap at the start of a new week as the US-Iran war-led global flight to safety boosts the US Dollar. Spot prices, however, lack follow-through selling and manage to hold above mid-1.1700s during the Asian session.

GBP/USD targets 1.3500 barrier near moving averages

GBP/USD rebounds from the daily losses, trading around 1.3450 during the Asian hours on Monday. The technical analysis of the daily chart indicates an ongoing bearish bias, as the pair trades within a descending channel pattern.

Gold retreats from $5,400; still up over 1% amid Middle East tensions

Gold retreats from the $5,400 neighborhood, or its highest level since late January, touched in the Asian session on Monday, though it manages to hold above the $5,300 round figure. The bright metal opened with a bullish gap of about $17 and rallied toward the $5,400 level as Asian traders hit their desks and reacted negatively to the weekend news of the US and Israel attacks on Iran, rushing for cover in Gold.

Top Crypto Losers: Tezos, Toncoin, and Polkadot at crucial levels amid US-Israel strike on Iran

Altcoins such as Tezos, Toncoin, and Polkadot rank among the worst hit cryptocurrencies over the last 24 hours amid the US and Israel's attack on Iran. Tezos and Toncoin are down to crucial support levels while Polkadot remains near a crucial resistance trendline, showcasing underlying strength.

The market is paying for insurance, not apocalypse

As expected, this morning felt less like a Monday market open and more like a fire drill. Futures screens flickered red. S&P contracts down almost 1%. Nasdaq off 1.2%. Brent leaped 13% through $80. Gold rose 1.6% toward $5350 before paring some gains. The dollar is strutting mildly. The Swiss franc is quietly doing what it always does in a storm, catching some safe-haven flows.

Starknet unveils strkBTC, shielded Bitcoin transactions on Ethereum Layer 2

Starknet, the Ethereum Layer 2 network developed by StarkWare, today announced strkBTC, a wrapped Bitcoin asset that introduces optional shielding while preserving full DeFi composability.