- Gold stays stuck in a sideways market in the last month of 2019.
- The level to beat for buyers is the 1480/85 resistance zone.
- The main support is seen at the 1460/50 price zone.
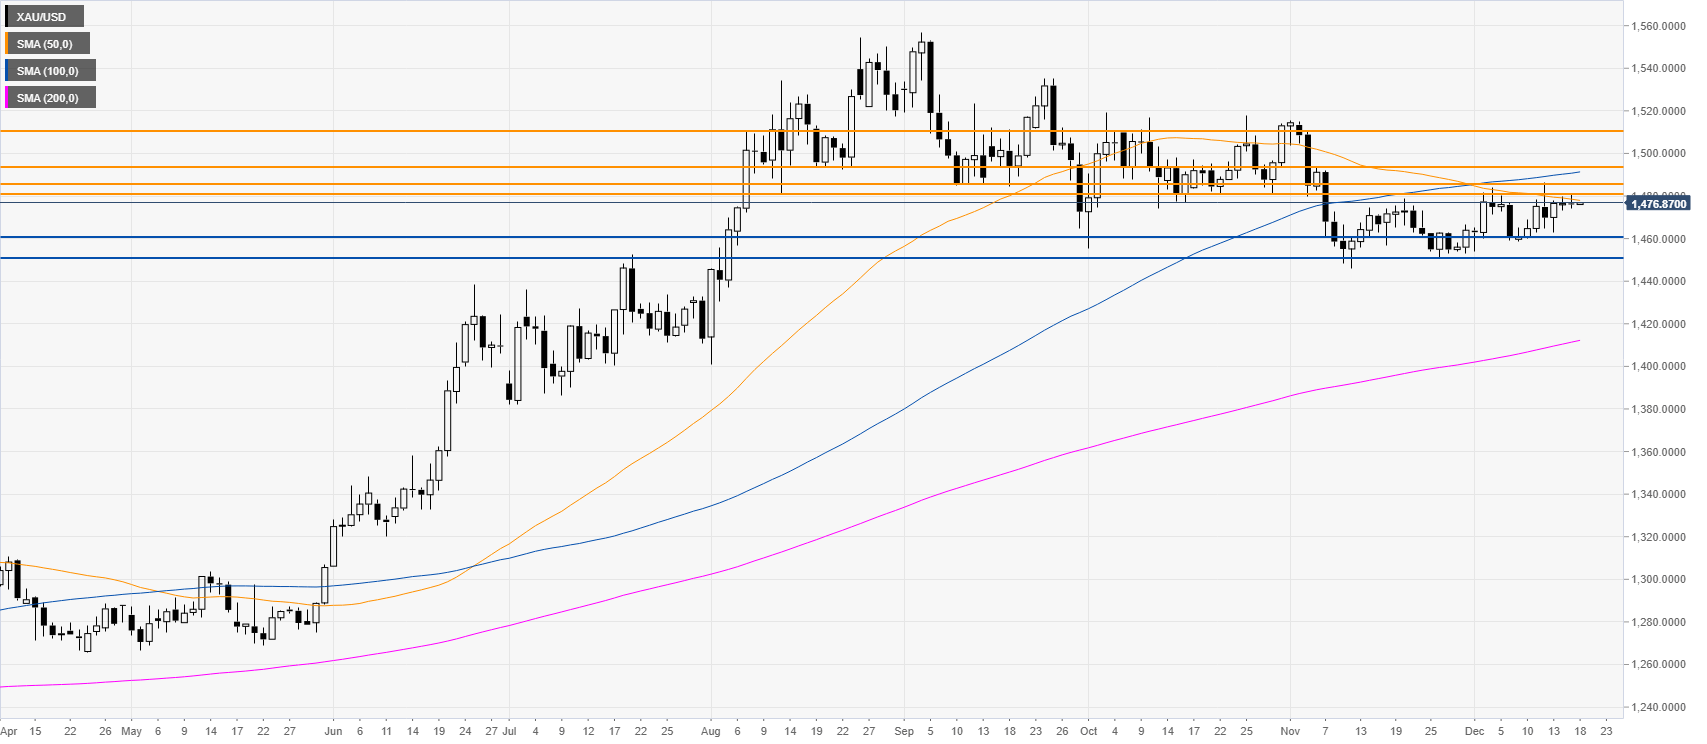
Gold daily chart
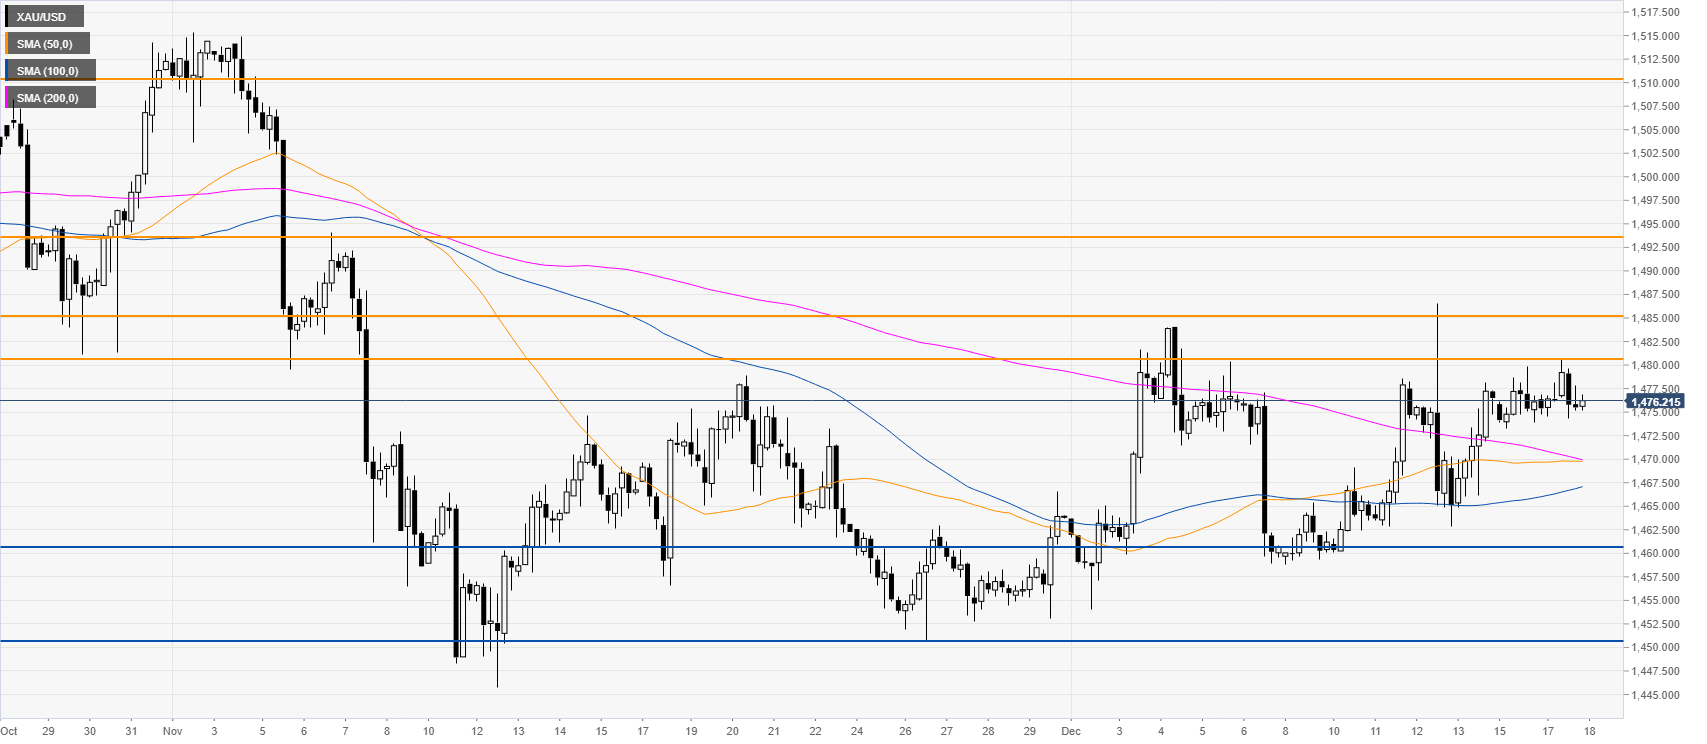
Gold four-hour chart
Additional key levels
Information on these pages contains forward-looking statements that involve risks and uncertainties. Markets and instruments profiled on this page are for informational purposes only and should not in any way come across as a recommendation to buy or sell in these assets. You should do your own thorough research before making any investment decisions. FXStreet does not in any way guarantee that this information is free from mistakes, errors, or material misstatements. It also does not guarantee that this information is of a timely nature. Investing in Open Markets involves a great deal of risk, including the loss of all or a portion of your investment, as well as emotional distress. All risks, losses and costs associated with investing, including total loss of principal, are your responsibility. The views and opinions expressed in this article are those of the authors and do not necessarily reflect the official policy or position of FXStreet nor its advertisers.
Latest Forex News
Editors’ Picks
AUD/USD regains traction to 0.7800 on upbeat Australian trade numbers, ignores soft Retail Sales
AUD/USD picks up bids from the intraday low on strong trade data. The quote extends bounce off 0.7752 following the upbeat trade figures for January while also paying a little heed to the soft Retail Sales figure for the stated month.
GBP/USD: Drops towards 1.3900 on the way to two-week-old support line
GBP/USD teases intraday low of 1.3921, currently down 0.14% around 1.3932, during Thursday’s Asian session. In doing so, the cable stretches the pullback from a one-week-old resistance line as MACD recedes bullish bias.
Gold: Bears looking to test bull's commitments at $1,698
The gold price is no longer showing signs of an immediate advance back to test $1,760. Instead, gold failed to extend beyond $1,740 and printed a fresh low to $1,702 as the US dollar and yields came up for air.
Dogecoin price on the brink of a 40% explosion towards $0.07
Dogecoin price has been trading sideways for the past two days and inside a downtrend since its new all-time high of $0.087 on February 7. Now, the favorite canine-cryptocurrency is ready for a new leg up.
DXY continues to gain on Wednesday, eyes 91.60
US dollar firm and approaching Feb 4th highs from a significant technical support structure. US economy moderately gathering pace according to the Fed's Beige Book.