Gold Price Analysis: XAU/USD recaptures $1900, doors open towards $1912 – Confluence Detector

Gold (XAU/USD) has cleared the $1900 level on Monday, surging 1% to reach over one-week highs. The extension to the last week’s rally comes on the back of a much-awaited US fiscal stimulus deal. US Congress reached an agreement on a $900 billion COVID-19 relief aid package on Sunday, with votes likely on Monday.
Gold also benefited from the coronavirus-induced fresh lockdowns imposed globally, defying the strengthening haven demand for the US dollar. Heading into the holiday-shortened Christmas week, let's see how is gold positioned on the charts.
Gold Price Chart: Key resistances and supports
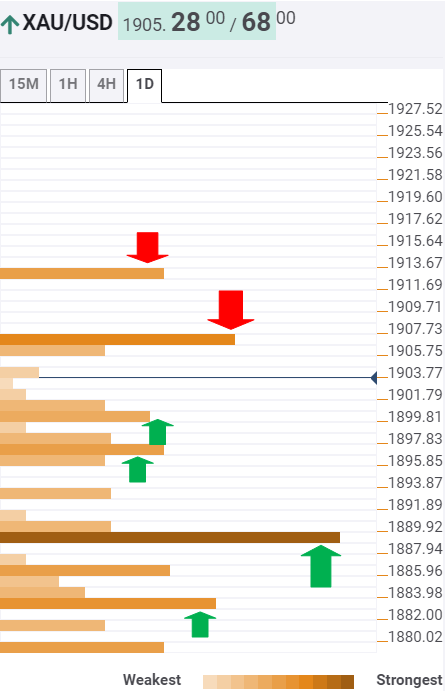
The Technical Confluences Indicator shows that the XAU/USD pair has finally taken out the key $1900 level, which was the confluence of the Pivot Point one-day R3 and Bollinger Band four-hour Upper.
The buyers now target the $1907 barrier, where the SMA100 one-day coincides with the Pivot Point one-month R1.
The next resistance awaits at the Pivot Point one-week R1 of $1912. Acceptance above the latter could open doorways to heaven.
On the flip side, a breach of the $1900 support could put the $1896 cushion at risk. That level is the previous week high.
Minor support is seen at $1892, which is the convergence of the Bollinger Band one-day Upper and 15-minutes Lower.
Bears will then eye a sustained move below $1888, the intersection of the Fibonacci 61.8% one-month and Pivot Point one-day R1, to accelerate the downward pressure.
Further south, the next relevant support is aligned at $1883, which is the Fibonacci 38.2% one-day.
Here is how it looks on the tool
About Confluence Detector
The TCI (Technical Confluences Indicator) is a tool to locate and point out those price levels where there is a congestion of indicators, moving averages, Fibonacci levels, Pivot Points, etc. Knowing where these congestion points are located is very useful for the trader, and can be used as a basis for different strategies.
Author

Dhwani Mehta
FXStreet
Residing in Mumbai (India), Dhwani is a Senior Analyst and Manager of the Asian session at FXStreet. She has over 10 years of experience in analyzing and covering the global financial markets, with specialization in Forex and commodities markets.


