|

Gold Price Analysis: XAU/USD on the edge of critical support at $1,857 – Confluence Detector

Will the Federal Reserve print less money? Will the new administration pump more funds into the economy? Gold traders are weighing in the rising prospects of less bond-buying from the Fed, but perhaps a generous package from President-elect Joe Biden, as Democrats are set to have full control of the Senate. 

The precious metal has been stabilizing but that may not last for too long. 

How is XAU/USD positioned on the technical graphs?

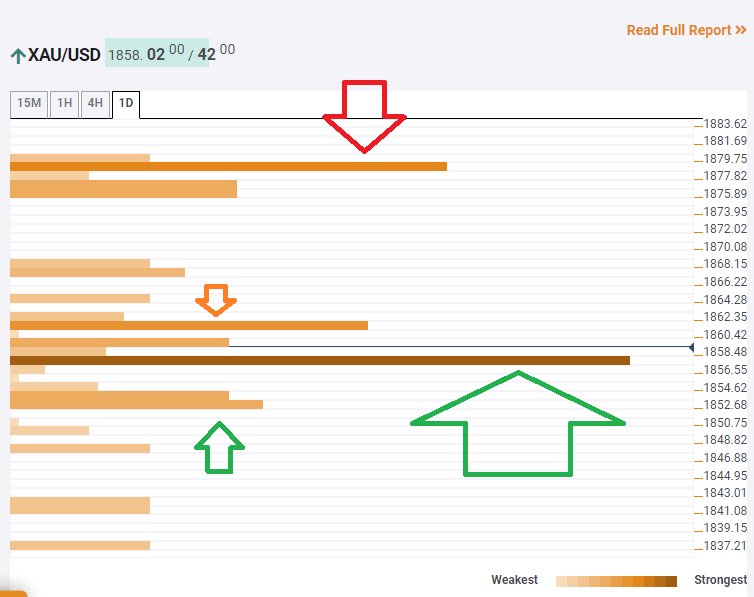
The Technical Confluences Indicator is showing that gold is approaching critical support at $1,857, which is the convergence of the Simple Moving Average 5-4h, the Fibonacci 38.2% one-month, the Bollinger Band 1h-Middle, the Fibonacci 23.6% one-day, and more. 

Further down, the next cushion is $1,852, which is a juncture including t the SMA 200-15m, the SMA 50-1h, the Bollinger Band 1h-Lower, and more. 

Weak resistance awaits at $1,861, which is the melting point of the BB 15min-Upper and the previous 1h-high. 

The upside target is $1,878, which is the confluence of the of Fibonacci 38.2% one-week and the Pivot Point one-day R2. 

XAU/USD resistance and support levels

Confluence Detector

The Confluence Detector finds exciting opportunities using Technical Confluences. The TC is a tool to locate and point out those price levels where there is a congestion of indicators, moving averages, Fibonacci levels, Pivot Points, etc. Knowing where these congestion points are located is very useful for the trader, and can be used as a basis for different strategies.

Learn more about Technical Confluence

Author

Yohay Elam

Yohay Elam

FXStreet

Yohay is in Forex since 2008 when he founded Forex Crunch, a blog crafted in his free time that turned into a fully-fledged currency website later sold to Finixio.

More from Yohay Elam
Share:

Editor's Picks

EUR/USD seems fragile below 1.1700 as Middle East war boosts energy prices

The EUR/USD pair trades flat at around 1.1680 during the Asian trading session on Tuesday, but broadly seems vulnerable, being close to its five-week low. The major currency pair is under pressure as surging oil prices due to the United States-Israel war with Iran have increased the risks of higher inflation for the Old Continent.

GBP/USD hovers around 1.3400 with bearish pressure intact

GBP/USD edges higher after three days of losses, trading around 1.3400 during the Asian hours on Tuesday. The technical analysis of the daily chart indicates an ongoing bearish bias, as the pair trades within a descending channel pattern.

Gold sticks to gains above $5,350 amid sustained safe-haven demand; firmer USD caps gains

Gold sticks to its positive bias for the third straight day and trades above the $5,350 level heading into the European session on Tuesday. Concerns about a broader regional conflict in the Middle East continue to weigh on investors' sentiment and underpin demand for the traditional safe-haven bullion.

Stellar risks deeper losses as derivatives metrics turn negative

Stellar is trading red below $0.16 at the time of writing on Tuesday, after a slight recovery the previous day. Weakening derivatives data caps the recovery, while an unfavorable technical outlook projects a deeper correction for the XLM token in the upcoming days.

The market is not panicking it is repricing the probability distribution of Oil and time

At the end of the day, markets do not trade morality or geopolitics. They trade transmission channels. And the only channel that truly matters in this maelstrom runs through the price of energy and the time value of money.

Hyperliquid Price Forecast: HYPE rises on commodities demand amid US-Iran war

Hyperliquid (HYPE) steadies above $33 at press time on Tuesday, marking its fourth consecutive day of recovery in a broadly volatile market due to the ongoing US-Israel strikes on Iran.