Gold Price Analysis: XAU/USD on the defensive ahead of Biden, levels to watch – Confluence Detector

Gold (XAU/USD) is consolidating within Thursday’s trading range above $1850, as investors await President Joe Biden’s speech for the next direction. Markets are weighing in the prospects of the US fiscal spending and its impact on the economic recovery.
Further, concerns over a quick passage of Biden’s $1.9 trillion stimulus proposal by the US Congress weigh on the metal. Profit-taking heading into the weekend also seems to keep the gold bulls unnerved.
Meanwhile, the US dollar wallows near weekly lows, which could offer some support to gold prices. Let’s look at the technical graphs for better understanding. How is gold positioned on the charts?
Gold Price Chart: Key resistances and supports
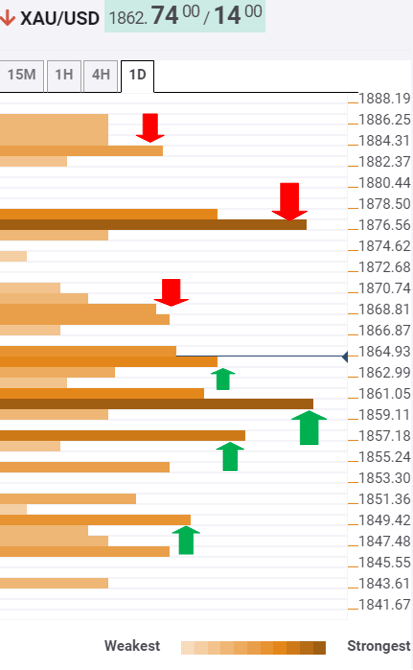
The Technical Confluences Indicator shows that gold is testing major support at $1863, which is the confluence of the SMA5 one-hour and the previous week high.
Powerful support at $1860 will guard the downside. That level is the intersection of the SMA50 one-day, pivot point one-day S1 and the previous low four-hour.
A failure to resist above the latter would open floors towards $1857, the Fibonacci 38.2% one-month.
Further south, the confluence of the SMA50 four-hour and SMA10 one-day at $1848 could challenge the bears’ commitment.
To the upside, strong resistance around $1870 could be tested. The Fibonacci 61.8% one-day and SMA10 four-hour meet at that point.
The XAU bulls need to crack critical barrier at $1877 (SMA100 four-hour, pivot point one-day R1) to unleash further upside.
The SMA100 one-day at $1883 would be next on the buyers’ radars.
Here is how it looks on the tool
About Confluence Detector
The TCI (Technical Confluences Indicator) is a tool to locate and point out those price levels where there is a congestion of indicators, moving averages, Fibonacci levels, Pivot Points, etc. Knowing where these congestion points are located is very useful for the trader, and can be used as a basis for different strategies.
Author

Dhwani Mehta
FXStreet
Residing in Mumbai (India), Dhwani is a Senior Analyst and Manager of the Asian session at FXStreet. She has over 10 years of experience in analyzing and covering the global financial markets, with specialization in Forex and commodities markets.


