|

Gold Price Analysis: XAU/USD needs to break $1,938 to unleash further gains – Confluence Detector

Gold has been moving higher in the hope the Congress approves a multi-trillion fiscal stimulus deal. President Donald Trump is reportedly eager to strike an accord ahead of the elections, while his fellow Republicans seem reluctant to go with him, especially given his standing in the polls. 

Will Trump get his way? The precious metal has been rising amid this optimism. How is it positioned on the charts? 

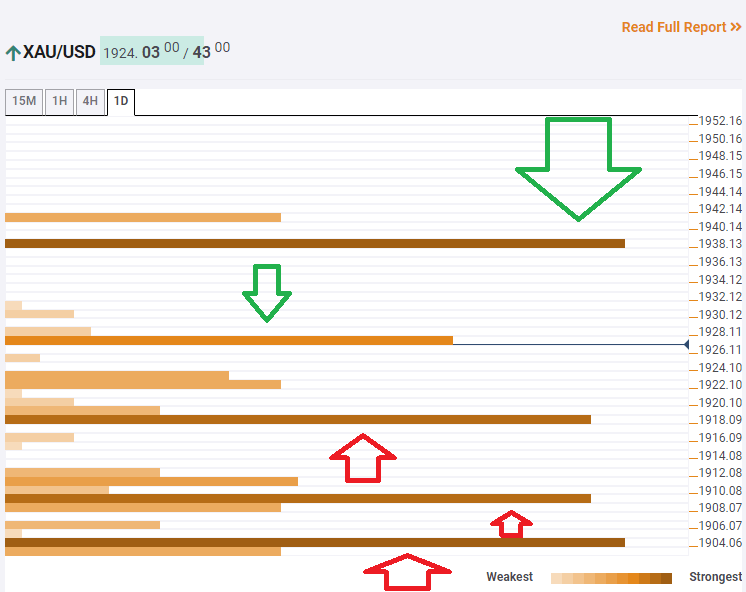
The Technical Confluences Indicator is showing that gold is battling mid-sized resistance at around $1,927, which is the convergence of the Pivot Point one-week Resistance1 and the Simple Moving Average 5-15m. 

A critical cap awaits at $1,939, which is where the Fibonacci 61.8% one-week and the 50-day SMA hit the price. Topping that level would unleash further upside. 

Support awaits at $1,918, which is a juncture including the previous weekly high and the Bollinger Band 4h-Upper. 

Further down, $1,909 is another cushion, being the meeting point of the BB 1h-Middle and the BB-one-day Middle. 

Next, $1,904 is where the Fibonacci 38.2% one-month and the PP one-day R1 converge. 

Key XAU/USD resistances and supports

Confluence Detector

The Confluence Detector finds exciting opportunities using Technical Confluences. The TC is a tool to locate and point out those price levels where there is a congestion of indicators, moving averages, Fibonacci levels, Pivot Points, etc. Knowing where these congestion points are located is very useful for the trader, and can be used as a basis for different strategies.

Learn more about Technical Confluence

Author

Yohay Elam

Yohay Elam

FXStreet

Yohay is in Forex since 2008 when he founded Forex Crunch, a blog crafted in his free time that turned into a fully-fledged currency website later sold to Finixio.

More from Yohay Elam
Share:

Editor's Picks

AUD/USD falls to near 0.7100 after slipping below 50-day EMA

AUD/USD depreciates after registering minor gains in the previous day, trading around 0.7120 during the Asian hours. The technical analysis of the daily chart shows the pair consolidating sideways within a rectangle pattern, as neither bulls nor bears gain control. The AUD/USD pair is holding a slight bearish tone however as it sits beneath both the nine-day and 50-day EMAs.

160.00: USD/JPY back near intervention territory after upbeat US jobs report

US Nonfarm Payrolls beat expectations by a wide margin in May, with 172K jobs added. The US Dollar rebounds after the release, helping USD/JPY recover from its intraday lows. Warnings from Japanese authorities continue to limit upside potential near the 160.00 threshold.

Gold targets $4,300 amid stronger Dollar

Gold faces increasing selling interest and navigates the area of three-month lows near the $4,300 mark per troy ounce on Friday. The precious metal’s decline comes as traders assess the stronger-than-expected NFP, while the bid bias in the Greenback and higher US Treasury yields also collaborate with the retracement.

Cardano hits five-year low even as Hoskinson clarifies "break" isn't an exit

Cardano (ADA) price is down 10% at press time on Friday, extending losses over 30% so far this week amid Charles Hoskinson's clarification that "break" isn't an exit.

Week ahead – Fed countdown begins amid US inflation data and geopolitical risks

Fed Chair Warsh’s first meeting approaches as key US inflation data could reshape expectations. Oil prices remain elevated as US-Iran talks continue; tariffs also return to the spotlight. ECB is expected to hike; will it be a one-off move or is July live?

The US economy defies the rules: 100 days into the Oil shock and the recession signal is still missing

More than three months after the start of the Iran war and the resulting disruption to global energy markets, the US economy continues to display remarkable resilience. The conflict has triggered a sharp rise in Oil prices, reignited inflationary pressures and fueled widespread concerns about a potential economic slowdown.