Gold Price Analysis: XAU/USD looks north, two key levels to watch out – Confluence Detector

Gold (XAU/USD) started out the US Non-Farm Payrolls (NFP) week on a solid footing, rallying nearly $20 on Monday. The metal bounced-off the SMA100 one-day support for the third straight day, courtesy of the broad retreat in the US dollar from two-month peaks.
The risk-on mood returned amid upbeat Chinese Industrial Profits data, lifting the sentiment on the global markets at the expense of the safe-haven greenback. Further, hopes of the US Congress reaching a fiscal stimulus deal also added to the broader market optimism.
Attention now turns towards a slew of speeches by the Fed policymakers, US Consumer Confidence data and the first US Presidential election debate for fresh cues on the prices. Meanwhile, let’s see how gold is positioned technically.
Gold: Key resistances and supports
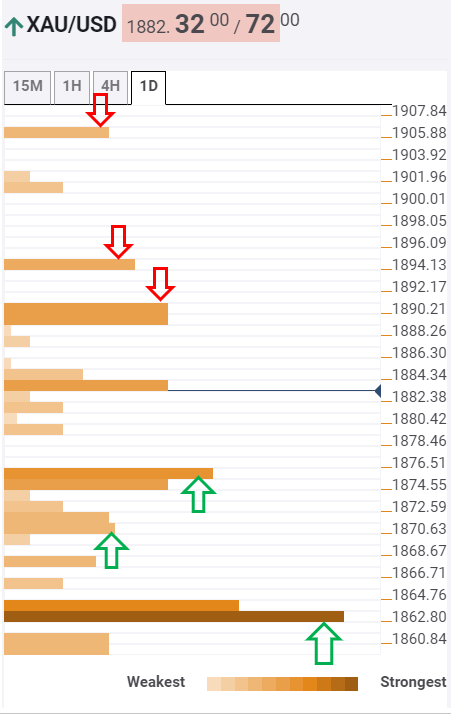
Following the corrective move higher, the Technical Confluences Indicator suggests that Gold faces immediate fierce resistance at $1889, which is the convergence of the Fibonacci 38.2% one-week and Bollinger Band 15-minutes Upper.
Buyers will then look to takeout the next hurdle at $1894, the intersection of the pivot point one-day R1 and Bollinger Band one-hour Upper.
A sharp rally towards the $1905 barrier will get fuelled, which is the pivot point one-day R2.
To the downside, significant support at $1875 could likely limit the pullbacks. At that level, the SMA5 one-day coincides with the Fibonacci 23.6% one-day.
Further down, a bunch of minor support levels will slow the declines before the bullion reaches the critical cushion at $1863, which is the convergence of the previous month low, Fibonacci 61.8% one-day and pivot point one-month S1.
Here is how it looks on the tool
About Confluence Detector
The TCI (Technical Confluences Indicator) is a tool to locate and point out those price levels where there is a congestion of indicators, moving averages, Fibonacci levels, Pivot Points, etc. Knowing where these congestion points are located is very useful for the trader, and can be used as a basis for different strategies.
Learn more about Technical Confluence
Author

Dhwani Mehta
FXStreet
Residing in Mumbai (India), Dhwani is a Senior Analyst and Manager of the Asian session at FXStreet. She has over 10 years of experience in analyzing and covering the global financial markets, with specialization in Forex and commodities markets.


