Gold Price Analysis: XAU/USD consolidating on the low end near $1,820
- Gold spot prices are settling on the low end after a tumultuous September.
- Higher-for-longer interest rates are keeping Gold prices fixed at the bottom.
- Gold demand led by Chinese markets is the only thing propping up XAU/USD.
- Despite recent declines, Gold spot prices remain historically elevated.

Spot Gold prices denominated in US Dollars are holding steady near $1,820 after skidding off of September's highs of $1,953 and is down from Gold's all-time peak of $2,079.76 set back in May of this year.
Rising Treasury yields have sent spot Gold prices into the planks as investors piled into the US Dollar in recent weeks, fueled by mounting concerns in the global markets that ongoing inflation battles at the majority of the world's major central banks will see financial market's lending and funding premiums remaining elevated for much longer than many previous expected.
US Treasuries have been marking in highs not seen since the global financial crisis, with the US 10-year Treasury yield tipping into 4.882% this week.
Gold Price Forecast: More constrained outlook for XAU/USD – UBS
Spot Gold is now trading into seven-month lows as markets continue to get rattled by the prospect of interest rates remaining elevated for much longer than investors would have liked to see.
One of Gold's remaining bright spots is Chinese market demand for the yellow metal: the People's Bank of China (PBoC) has been hoarding gold at a blistering pace for at least two years, with foreign reserve data noting that the PBoC purchased 29 tonnes of Gold in August, bringing the Chinese central bank's year-to-date Gold acquisitions to 155 tonnes since the start of 2023.
XAU/USD technical outlook
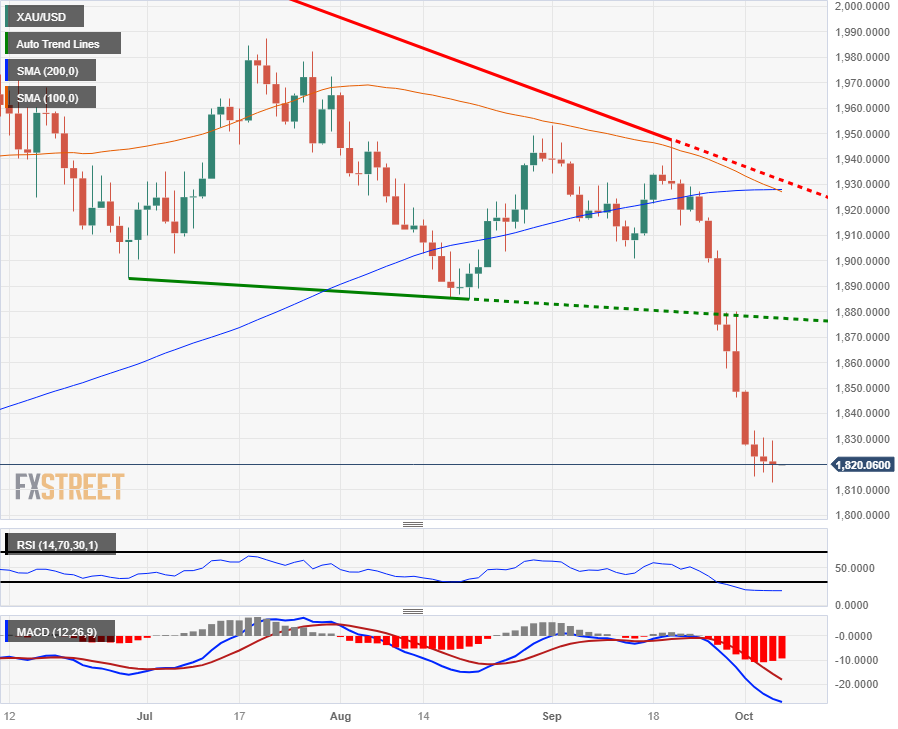
Spot Gold prices are steeply off near-term highs, trading into $1,8200 after testing a fresh seven-month low of $1,813.07 on Thursday. The XAU/USD has closed in the red for eleven of the last twelve consecutive trading days, but the pace of downside momentum has slowed this week, with Gold down a scant 0.42% from Tuesday's opening bids.
Gold prices are currently consolidating between $1,820 and $1,830 as market participants brace for Friday's upcoming US Non-Farm Payrolls (NFP) data drop, and XAU/USD's directional bias has twisted into the middle as investors wait to see how the US's economic outlook will lean on Federal Reserve (Fed) expectations.
Downside momentum in spot Gold has the 50-day Simple Moving Average (SMA) extending a bearish crossover of the 200-day SMA, and technical indicators are pinning into the low end, with the Relative Strength Index breaking the pins in oversold territory.
XAU/USD daily chart
XAU/USD technical levels
Author

Joshua Gibson
FXStreet
Joshua joins the FXStreet team as an Economics and Finance double major from Vancouver Island University with twelve years' experience as an independent trader focusing on technical analysis.


