|

Gold Price Analysis: XAU/USD challenges 50-HMA on the road to recovery towards $1700

  • Gold is set to regain the $1700 mark as short-term indicators favor the bulls.  
  • RSI has edged higher, piercing above the midline.
  • XAU bulls target the falling wedge hurdle at $1703.

Gold (XAU/USD) looks to extend its recovery from nine-month lows of $1677, heading into the European session this Tuesday, having found solid bids around the $1685 region.

At the time of writing, gold is wavering within a potential two-week-old falling wedge formation, challenging the bearish 50-hourly moving average (HMA) at $1694.

An hourly candlestick closing above that level could boost the renewed upside, calling for a test of the powerful hurdle at $1703. That level is the intersection of the downward-sloping 100-HMA and falling trendline resistance.

Acceptance above the critical resistance could validate a falling wedge breakout, opening doors for a test of the bearish 200-HMA at $1727.

The Relative Strength Index (RSI) edges higher above the midline, suggesting that there is extra scope for the recovery.  

Gold Price Chart: One-hour

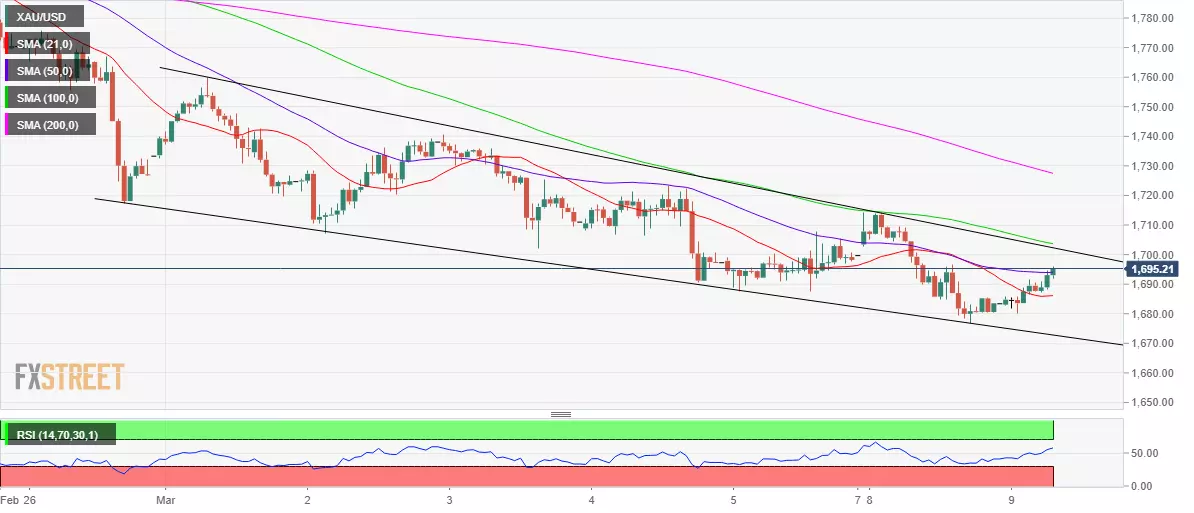
Alternatively, the 21-HMA at $1686 offers an immediate cushion, below which the falling trendline support at $1673 could be put at risk.

A sharp sell-off towards the $1650 psychological level cannot be ruled out if the bulls fail to resist above the June 2020 low near $1670.

Gold Additional levels

XAU/USD

Overview
Today last price1692.69
Today Daily Change12.08
Today Daily Change %0.72
Today daily open1680.6
 
Trends
Daily SMA201771.56
Daily SMA501825.29
Daily SMA1001846.36
Daily SMA2001859.82
 
Levels
Previous Daily High1714.32
Previous Daily Low1676.87
Previous Weekly High1759.98
Previous Weekly Low1687.37
Previous Monthly High1871.9
Previous Monthly Low1717.24
Daily Fibonacci 38.2%1691.18
Daily Fibonacci 61.8%1700.01
Daily Pivot Point S11666.87
Daily Pivot Point S21653.15
Daily Pivot Point S31629.42
Daily Pivot Point R11704.32
Daily Pivot Point R21728.05
Daily Pivot Point R31741.77

Author

Dhwani Mehta

Dhwani Mehta

FXStreet

Residing in Mumbai (India), Dhwani is a Senior Analyst and Manager of the Asian session at FXStreet. She has over 10 years of experience in analyzing and covering the global financial markets, with specialization in Forex and commodities markets.

More from Dhwani Mehta
Share:

Editor's Picks

AUD/USD eyes 0.7150 barrier nine-day EMA

AUD/USD inches higher after registering modest losses in the previous day, trading around 0.7130 during the Asian hours. The technical analysis of the daily chart indicates that the pair is moving sideways within the rectangle pattern, suggesting a consolidation as neither the bulls nor the bears have enough momentum to take control of the market.

USD/JPY trades below 160.00 intervention threshold; bullish bias intact

The USD/JPY pair attracts some sellers during the Asian session amid fears that authorities will step in again to prop up the Japanese Yen. Furthermore, the Israel-Lebanon truce prompts some profit-taking around the US Dollar and exerts downward pressure on the currency pair.

Gold rebounds from one-week low as Israel-Lebanon truce pressures safe-haven USD

Gold gains some positive traction on Thursday and climbs to the $4,475 area during the Asian session, reversing a major part of the previous day's slide to a one-week low. The Israel-Lebanon truce prompts some profit-taking around the US Dollar and supports the commodity. 


Hyperliquid: ETF demand, capital rotation fuel HYPE rally as Bitcoin melts

Hyperliquid price sustains an upward trend near its all-time high of $75.76 on Thursday after posting 80% gains in May, while Bitcoin (BTC) retraces below $65,000, triggering a market-wide panic.

Kevin Warsh takes the Fed helm: What it means for the US Dollar
The Federal Reserve moves away from the highly predictable "forward guidance" model of the Jerome Powell era to a new “Kevin Warsh environment”, characterized by less communication, more policy surprises, and an increased focus on the Fed's complex balance sheet.
Recession on paper: What really moves the Canadian Loonie now?

Statistics Canada handed the headline writers a gift and the analysts a headache. Real GDP shrank 0.1% on an annualized basis in the first quarter, and with the fourth quarter of 2025 revised down to a 1.0% contraction, that is two negative quarters in a row, the textbook definition of a technical recession and Canada's first since the pandemic.